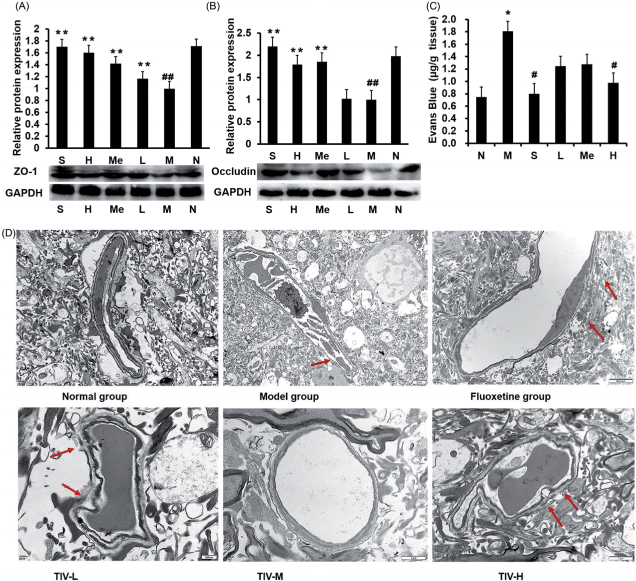
Figure 7.
Comparison of BBB permeability and protein expression in TIV-treated CUMS mice and controls. (A) ZO-1 expression in TIV-treated CUMS mice. (B) Occludin expression in TIV-treated CUMS mice. (C) Changes in BBB permeability. (D) Observation of TJ ultrastructure changes in the BBB by transmission electron microscopy. The red arrow indicates a break or discontinuity in the basement membrane. Data are reported as mean ± SD. # p < 0.05 and ## p < 0.01 vs. the normal group. *p < 0.05 and **p < 0.01 vs. the model group. N: normal; M: model; S: fluoxetine; L: TIV-L; Me: TIV-M; H: TIV-H (n = 3 per group).

