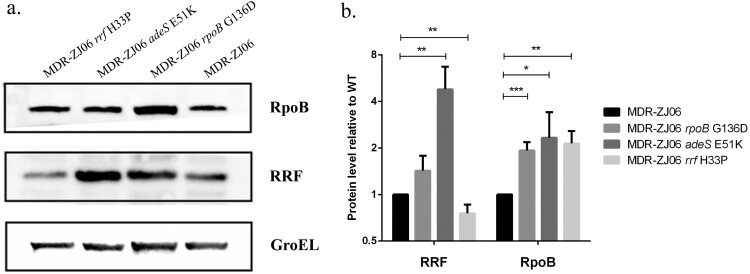
Figure 3.
Western blot analysis of A. baumannii MDR-ZJ06, XH1456, XH1457 and XH1458. (a) Comparison of protein levels between WT and mutants. Western blot analysis was performed for RpoB and RRF. GroEL was used as a loading control. (b) Quantification of immunoblots from four independent experiments using ImageJ software. Pixel intensity corresponds to protein levels. Asterisks indicate significant differences (*p < 0.05, **p < 0.01, ***p < 0.001) between compared groups using t test analysis.

