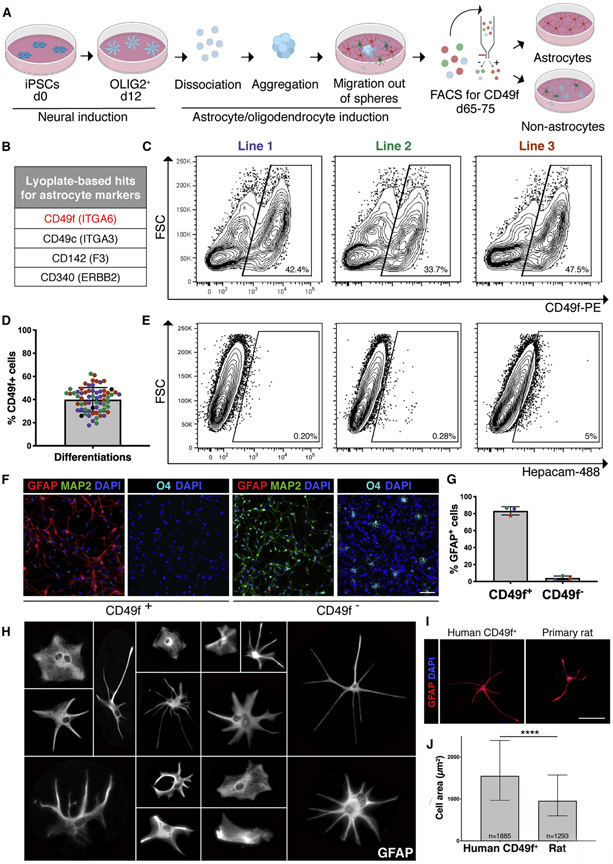
Figure 1: CD49f surface antigen purifies hiPSC-derived astrocytes.
See also Figures S1 and S2.
a) Schematic of hiPSC-astrocyte differentiation protocol depicting the major steps leading to the CD49f sort.
b) Top four hits for astrocyte markers identified from the Lyoplate screen.
c) Representative flow-cytometry contour plots (with outliers shown) of the CD49f sort of hiPSC-cells generated from 3 hiPSC lines from three individuals using the astrocyte differentiation protocol in a).
d) Bar chart with individual data points plotted as circles, where colors represent 3 hiPSC lines, displays the consistent proportion of CD49f+ cells obtained from independent differentiations for each line. Error bars show mean ± standard deviation (n=65). At least 5 independent differentiations per line were performed.
e) Representative contour plots (with outliers shown) of the EpCAM sort of hiPSC-cells generated from 3 lines.
f) Representative immunofluorescence images of CD49f+ and CD49f− cells 24 hours post-sort showing GFAP+ astrocytes (red), MAP2+ neurons (green), O4+ immature oligodendrocytes (cyan), and total DAPI cells (blue). Scale bar, 100μm.
g) Vast majority of sorted CD49f+ cells are also GFAP+, while almost no CD49f− cells are GFAP+ cells. Colored dots correspond to 3 different lines. Error bars show mean ± standard deviation (n=3 independent lines).
h) Representative images of individual magnified CD49f+ astrocytes cultured at low density and stained with GFAP, showing their morphological heterogeneity. Each cell was cropped and placed in the image.
i) Representative immunofluorescence images of hiPSC-derived CD49f+ astrocytes and primary rat astrocytes stained with GFAP (red) and DAPI (blue) show human cells are larger in size. Scale bar, 100μm.
j) Bar graph showing the median of the cell area in μm2 of GFAP+ hiPSC-derived CD49f+ astrocytes (n= 1885 cells from 3 lines with 1-2 replicates each) is significantly greater than that of primary rat astrocytes (n=1293 cells from 6 replicates). Error bars represent the interquartile range. p-value was calculated using a two-tailed, unpaired t-test.

