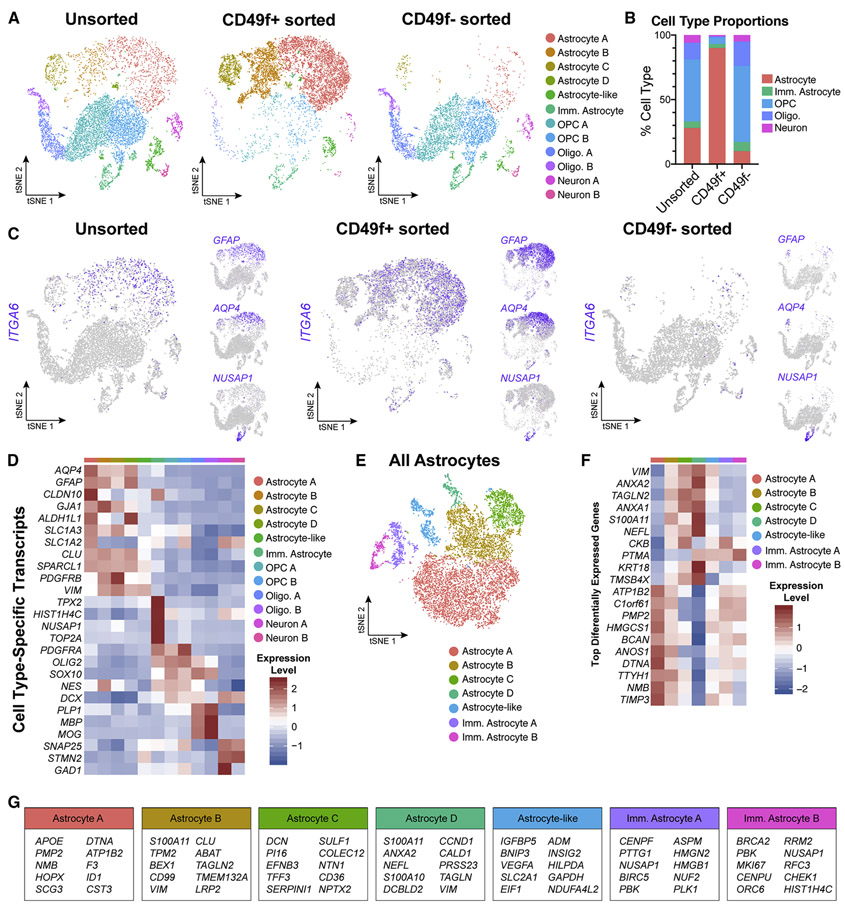
Figure 3: Single-cell transcriptome data confirms that CD49f+ sorting strategy from heterogeneous hiPSC-derived cultures enriches for mature astrocytes.
All data from one control line (line 3, n=1). See also Figures S4, S5, S6, and Supplemental Table 1.
a) tSNE plots of single-cell RNA-Seq data from unsorted (left, n = 7,744), CD49f+ (middle, n = 9,047), and CD49f sorted (right, n = 5,057) cells. In total, 12 clusters were identified.
b) Quantification of cell type proportions from unsorted, CD49f+, and CD49f− sorted cells based on tSNE analysis. CD49f+ sorted cells are mostly astrocytes.
c) tSNE feature plots of CD49f (ITGA6), mature astrocyte (GFAP, AQP4), and immature astrocyte (NUSAP1) transcripts from unsorted, CD49f+ sorted, and CD49f− sorted cells, showing that CD49f+ cells express primarily mature astrocyte markers.
d) Heatmap of cell type–specific transcript expression across identified clusters.
e) tSNE plot of all astrocytes from unsorted, CD49f+, and CD49f− sorted cells (n = 12,061 astrocytes). After subsetting and reintegrating only astrocytes from the initial clustering scheme, we identified 2 immature and 4 mature astrocyte clusters, and 1 astrocyte-like cluster.
f) Heatmap of top differentially expressed genes identified across all astrocyte-related clusters.
g) Top 10 differentially expressed genes for each astrocyte-related cluster.
Abbreviations: Imm.=immature; Oligo=oligodendrocyte; OPC=oligodendrocyte progenitor cell.

