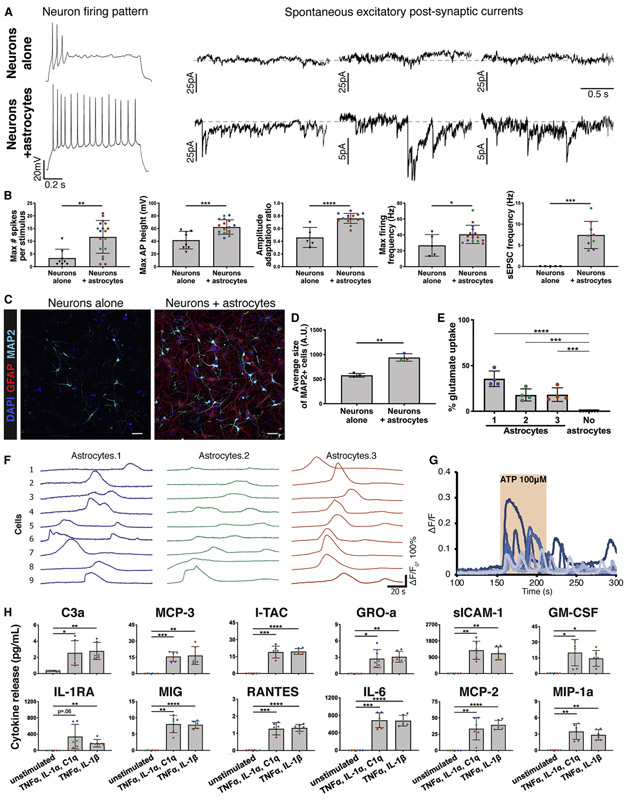
Figure 5: CD49f+ hiPSC-derived astrocytes provide neuronal support and exhibit other astrocytic functions in vitro.
See also Figure S8.
a) Representative recordings of firing patterns and spontaneous excitatory post-synaptic currents (sEPSCs) measured in hiPSC-neurons at day 50 when cultured alone, or with CD49f+ hiPSC-astrocytes during days 33-50. Neurons co-cultured with astrocytes exhibited more mature firing patterns and a greater number of sEPSCs.
b) CD49f+ hiPSC-astrocytes enhance electrophysiological properties of hiPSC-neurons in co-culture. Bar graphs show the maximum number of evoked spikes per 1 second stimulus (n=8/18), the maximum firing frequency in hertz (Hz) (n=5/15), the amplitude adaptation ratio between first and last action potential (n=5/15), the maximum action potential height (mV) (n=8/17), and the frequency of spontaneous excitatory post-synaptic currents (Hz) (n=5/9) in hiPSC-neurons at day 50 when cultured alone vs. with astrocytes during days 33-50. Colored dots correspond to 3 different lines. Each dot represents an independent cell. n=neurons alone/neurons co-cultured with astrocytes. Error bars show mean ± standard deviation. p-values were calculated using a two-tailed, unpaired t-test.
c) Representative immunofluorescence images showing MAP2+ neurons (cyan), GFAP+ astrocytes (red), and DAPI nuclei in hiPSC-derived neurons at 40 days in vitro cultured alone or with CD49f+ hiPSC-astrocytes for one week. Scale bar, 50μm.
d) Average size of MAP2+ cells. Colored dots correspond to 3 different CD49f+ hiPSC-astrocyte lines. Error bars show mean ± standard deviation (n=3 technical replicates). p-values were calculated using a two-tailed, unpaired t-test.
e) CD49f+ astrocytes take up glutamate. Bar graphs show percent of glutamate taken up by CD49f+ hiPSC-astrocytes after incubation with 100 μM glutamate for 3 hours, compared to wells without cells (media only). Colored dots correspond to 3 different astrocyte lines. Error bars show mean ± standard deviation (n=4 technical replicates). p-values were calculated using a one-way ANOVA with Dunnett’s correction for multiple comparisons.
f) hiPSC-astrocytes show spontaneous Ca2+ transients. Nine representative traces of spontaneous [Ca2+]i transients from 3 independent CD49f+ hiPSC-astrocyte lines loaded with the Ca2+ indicator Rhod-3/AM are shown. Each line is represented by a different color (lines 1,2,3).
g) CD49f+ hiPSC-astrocytes respond to ATP. Representative traces of [Ca2+]i transients from nine astrocytes from one iPSC line loaded with the Ca2+ indicator Rhod-3/AM following 100 μM ATP application.
h) CD49f+ hiPSC-astrocytes secrete proinflammatory cytokines when stimulated for 24 hours with TNFα, IL-1α, and C1q, or TNFα and IL-1β. Bar charts with individual data points plotted as dots show concentration of cytokines secreted in the supernatant of CD49f+ astrocytes with and without stimulation. Concentrations are expressed in pg/ml and normalized to 1,000 cells. Colored dots correspond to 3 lines (n=6, 2 technical replicates per line). Error bars show mean ± standard deviation. p-values were calculated using a one-way ANOVA with Dunnett’s correction for multiple comparisons.

