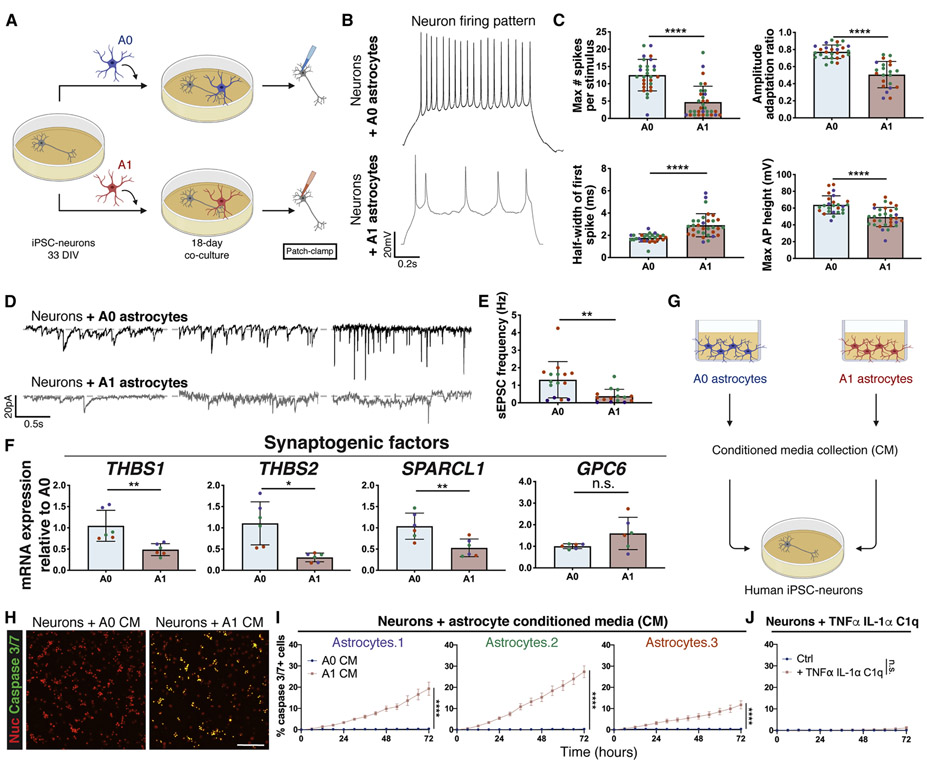
Figure 7: A1-like reactive CD49f+ hiPSC-derived astrocytes impair neuronal maturation and connectivity and are neurotoxic.
See also Figure S10.
a) Schematic of neuron co-culture experiment with A0 and A1 hiPSC-astrocytes.
b) Representative recordings of firing patterns measured in hiPSC-neurons at day 51 when cultured with A0 or A1 astrocytes during days 33-51. Neurons co-cultured with A1 astrocytes exhibited less mature firing patterns.
c) A1 astrocytes provide markedly lower enhancements of neuronal electrophysiological properties in co-culture than A0 astrocytes. Bar graphs with individual data points plotted show the maximum number of evoked spikes per 1s stimulus (n=28/32), the half-width of the first spike (ms) (n=28/32), the amplitude adaptation ratio between first and last action potential (n=27/22), and the maximum action potential height (mV) (n=26/32) in hiPSC-neurons at day 51 when cultured with A0 or A1 astrocytes during days 33-51. Colored dots correspond to 3 different lines. Each dot represents an independent cell from which we recorded. n=neurons co-cultured with A0 astrocytes/neurons co-cultured with A1 astrocytes. Error bars show mean ± standard deviation. p-values were calculated using a two-tailed, unpaired t-test.
d) Representative recordings of spontaneous excitatory post-synaptic currents (sEPSCs) measured in hiPSC-neurons at day 51 when cultured with A0 or A1 astrocytes during days 33-51. Neurons co-cultured with A1 astrocytes exhibited a smaller number of sEPSCs. Representative traces of sEPSCs are each from a different cell.
e) Frequency of spontaneous excitatory post-synaptic currents (Hz) (n=15 co-cultured with A0 astrocytes;15 co-cultured with A1 astrocytes) in hiPSC-neurons at day 51 when cultured with A0 or A1-like astrocytes during days 33-51. Colored dots correspond to 3 different lines. Each dot represents an independent cell from which we recorded. Error bars show mean ± standard deviation. p-values were calculated using a two-tailed, unpaired t-test.
f) Relative mRNA expression of genes encoding synaptogenic factors, quantified via qPCR analysis, is decreased in A1 vs. A0 astrocytes. Colored dots correspond to 3 different lines. Error bars show mean ± standard deviation (n=6, 2 replicates per line). p-values were calculated using a two-tailed, paired t-test.
g) Schematic of A0 vs. A1 astrocyte conditioned media experiment on hiPSC-neurons.
h) Representative images of neurons treated with A0 or A1 astrocyte conditioned media (CM) for 3 days, subjected to a caspase 3/7 apoptosis assay (green) and cell nuclei (red); neurons exposed to A1 CM show increased apoptosis. Scale bar, 100μm.
i) Time course apoptosis analysis and quantification of the percentage of caspase 3/7+ neurons during treatment with A0 or A1 astrocyte conditioned media (CM). Error bars represent the standard error of the mean (n=12-24 replicates per line), indicating a neurotoxic effect of A1 CM on neurons. p-values were calculated using a two-way ANOVA.
j) Time course apoptosis analysis and quantification of the percentage of caspase 3/7+ apoptotic neurons during stimulation with TNFα, IL-1α, and C1q, demonstrating no direct effects of the cytokine cocktail on neuronal apoptosis. Error bars represent the standard error of the mean (n=12 replicates). p-values were calculated using a two-way ANOVA.

