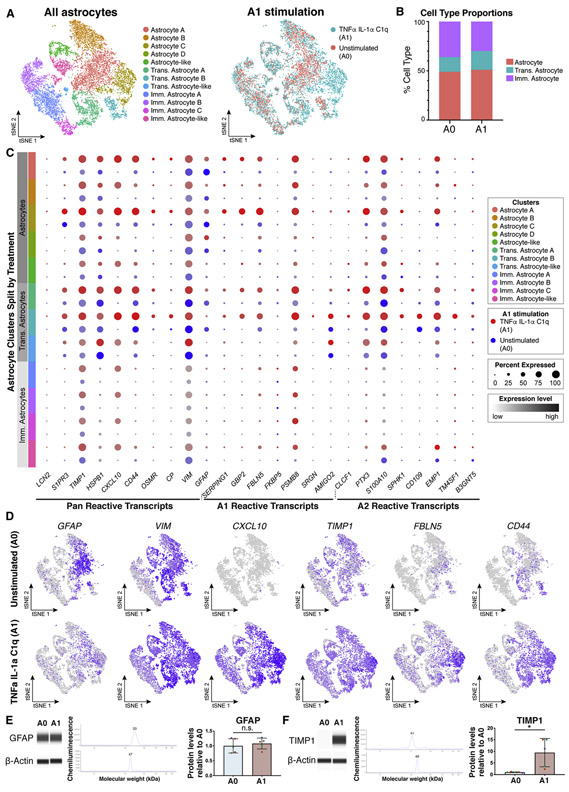
Figure 8: Maturation state affects CD49f+ hiPSC-derived astrocytes response to stimulation with TNFα, IL1α, and C1q.
See also Supplemental Table 1.
a) tSNE plots of single-cell RNA-Seq data from unstimulated (A0, n = 5,881) and TNFα, IL-1α, and C1q stimulated (A1, n = 6,701) astrocytes, shown by cluster (left) and by treatment type (right). Data from two iPSC lines (lines 1 and 3, n = 2).
b) Quantification of cell type proportions from unstimulated (A0) and A1 astrocytes.
c) Dot plot of pan, A1-specific, and A2-specific astrocyte transcripts in A0 (blue) and A1 astrocytes (red), highlighting a stronger gene expression response in mature astrocytes. Dot size represents the percentage of cells that express a transcript, and color intensity represents the expression level of a transcript.
d) tSNE feature plots of reactive astrocyte transcripts.
e) GFAP protein levels are stable in A0 and A1 CD49f+ hiPSC-astrocytes. Western blots for GFAP and b-actin, and quantification of protein levels, normalized to b-actin. Error bars show mean ± standard deviation (n=5, 1-2 replicates per line). Colored dots correspond to 3 different lines. p-values were calculated using a two-tailed, paired t-test.
f) TIMP1 level increases in CD49f+ hiPSC-astrocytes stimulated to A1. Western blots for TIMP1 and b-actin, and protein quantification, normalized to b-actin. Error bars show mean ± standard deviation (n=5, 1-2 replicates per line). Colored dots correspond to 3 different lines. p-values were calculated using a two-tailed, paired t-test.
Abbreviations: Imm.=immature; Trans.=transitioning.

