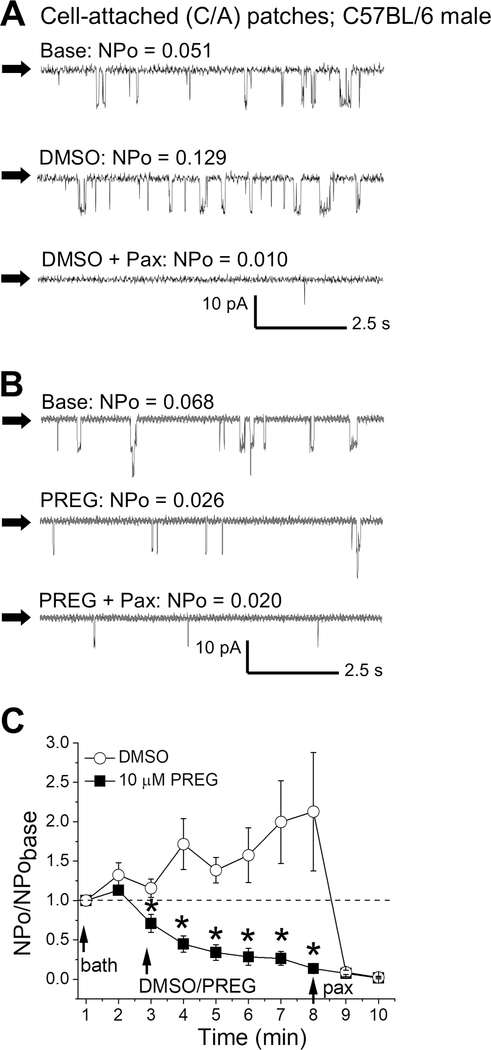
Figure 4. Pregnenolone inhibits BK activity in smooth muscle cells freshly isolated from mouse middle cerebral artery.
A. Representative cell-attached (C/A) records of BK opening during bath perfusion (top), DMSO perfusion (middle), or DMSO and 1 μM paxilline perfusion (bottom). Black arrows indicate baseline, channel openings are shown as downward deflections. Here and in B-C, all records were recorded at −30 mV. B. Representative C/A records of BK openings during bath perfusion (top), 10 μM PREG perfusion (middle), or 10 μM PREG + 1 μM paxilline perfusion (bottom). Black arrows indicate baseline, channel openings are shown as downward deflections. C. Averaged data showing NPo/NPobasal for each minute of recording. Dashed line at 1 (y-axis) indicates no change from basal channel activity. Black arrows indicate the start of perfusions. *Statistically significant difference from DMSO at each time-matched point (P<0.05, Mann Whitney U-test); n=5–8 for each group.

