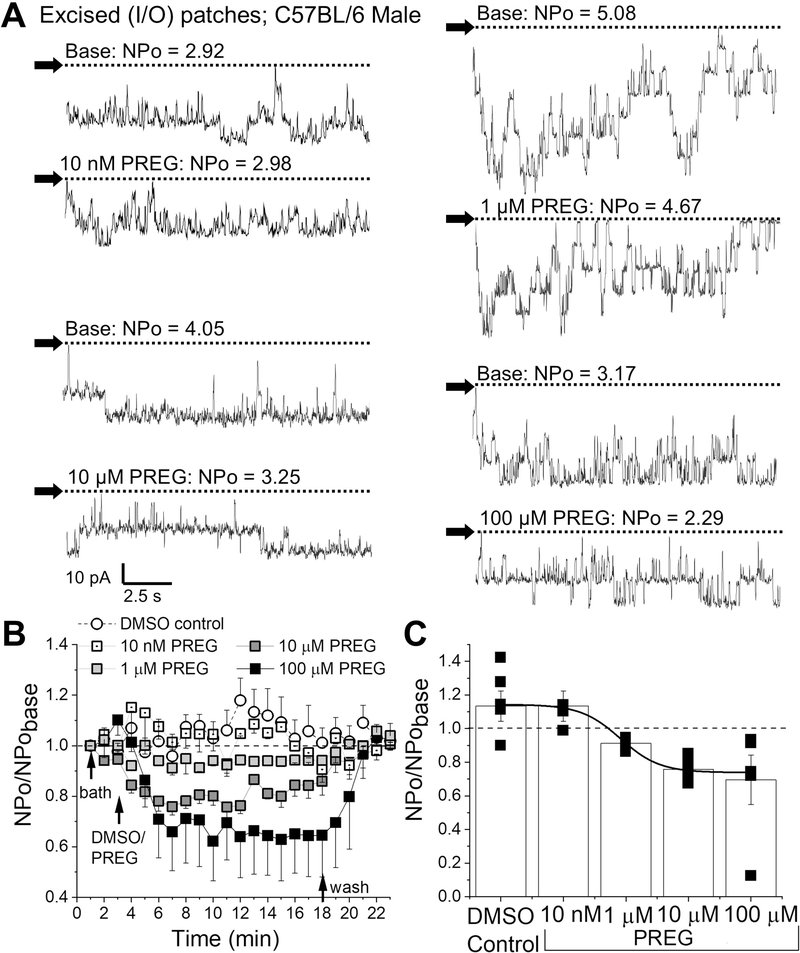
Figure 5. Pregnenolone inhibits BK activity independently of cell integrity.
A. Representative BK current recordings obtained from excised, inside-out (I/O) patches during bath perfusion (basal activity) and increasing amounts of PREG (10 nM-100 μM) in the perfusate. Horizontal dashed lines indicate the baseline. Black arrows indicate baseline, channel openings are shown as downward deflections. Here and in B-C, all records were recorded at +30 mV. B. Averaged data showing NPo/NPobasal for each minute of recording per concentration of PREG, compared to time-matched DMSO-containing perfusion. Horizontal dashed lines indicate the baseline. Black arrows indicate changes in perfusion. C. Averaged data highlighting maximal effects of increasing concentrations of PREG on BK channel activity. Black squares indicate individual points. A black line indicate data fitted to a Boltzmann function (concentration-response curve). A horizontal dashed line at 1 indicates no change from baseline activity; n=5 for each group.

