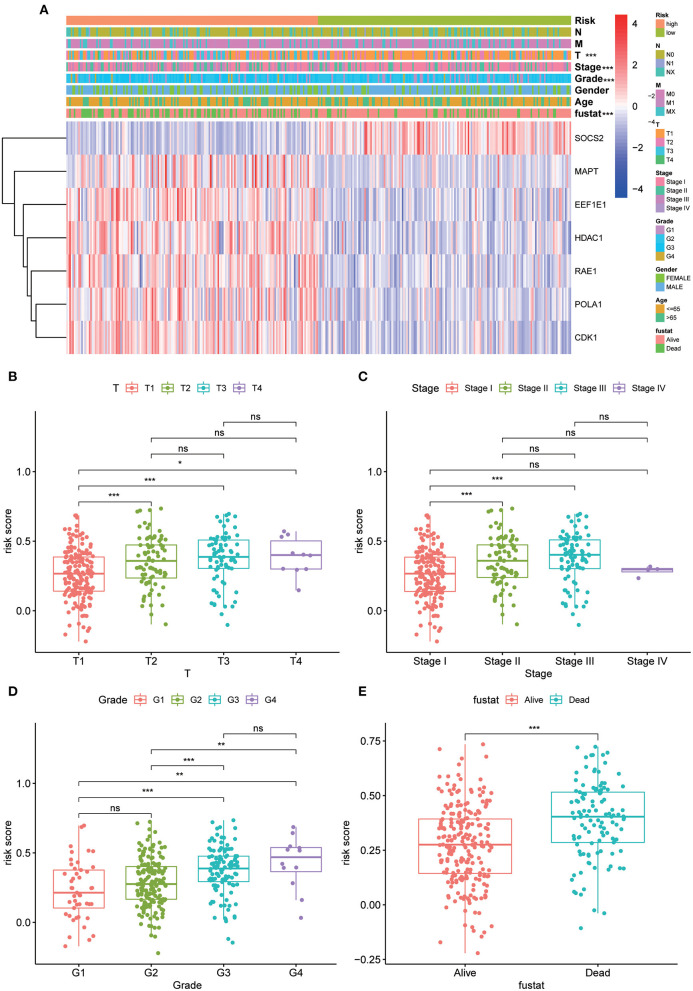
Figure 4.
Clinicopathological characteristics evaluation by the current 7 AGs model. Strip chart (A) along with the scatter diagram of (B) T stage, (C) clinical stage, (D) tumor grade, and (E) survival status between groups of high and low risk. Adjusted p values are shown as ns, not significant; *p < 0.05; **p < 0.01; ***p < 0.001.

