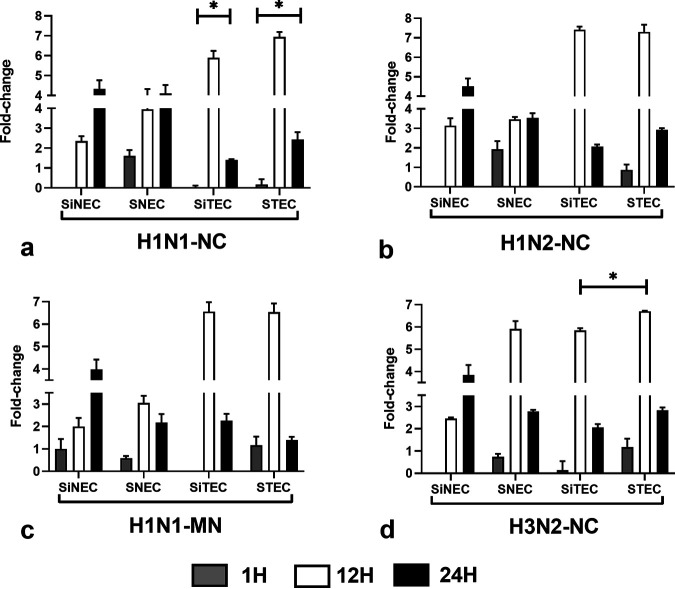
FIG 8.
Expression of OAS1. Panels show fold change in OAS1 expression (log10) between SNECs, SiNECs, STECs, and SiTECs infected with H1N1-NC (a), H1N2-NC (b), H1N1-MN (c), and H3N2-NC (d) relative to mock-infected cells and 18S rRNA as a housekeeping control. Data represent mean ± SEM of three replicates. *, P < 0.05. Statistical methods used to determine significance are described in detail in Materials and Methods.

