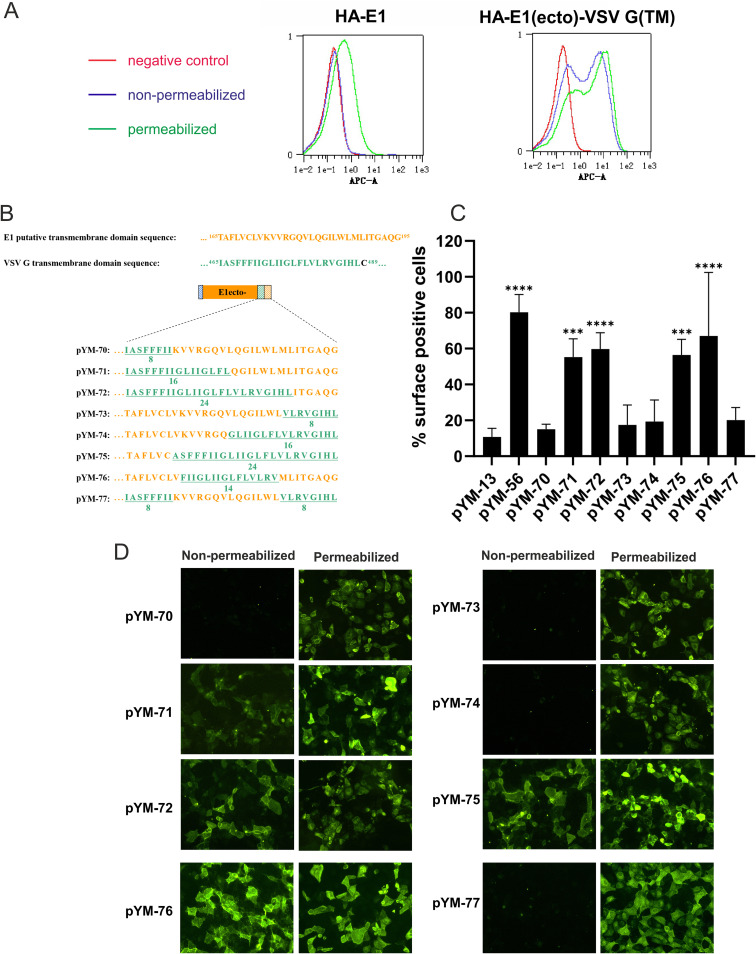
FIG 3.
The ER retention signal resides within the middle part of the E1 transmembrane domain. (A) As a control for cell surface expression analysis via flow cytometry, HA-tagged E1 wt (construct pYM-13) or a chimera composed of HA-tagged E1 ectodomain and VSV-G TM region (construct pYM-56) was expressed in RK-13 cells. Transfected cells were fixed by 4% PFA, permeabilized with Triton X-100 or left untreated, immune stained with α-HA/α-mouse FITC, and then analyzed with the MACSQuant. The red peak shows the fluorescence signal of RK-13 cells transfected with pCI empty vector under nonpermeabilization conditions, which served as a negative control; the blue and green peaks show the fluorescence signals of RK-13 cells transfected with the indicated plasmids under nonpermeabilization (blue) and permeabilization (green) conditions. Default settings in MACSQuant were used for flow cytometry analysis, and normalization of peak views was chosen for “height” to make the peaks comparable and the y axis remain on an equal scale. (B) Schematic representation of the chimeric transmembrane sequences used in this study. The original sequences of TM domains of both E1 and VSV-G are shown above. The sequences of E1/VSV-G chimeric TM anchors are presented below. (C) Cell surface expression of HA-tagged chimeric proteins analyzed by flow cytometry. The RK-13 cells were transfected with the given expression plasmids. At 24 h posttransfection, the cells were fixed with 4% PFA and stained with α-HA and α-mouse FITC and then analyzed in MACSQuant. The number of surface-positive cells for nonpermeabilized samples is given as the percentage of the number of positive permeabilized cells. Error bars indicate the standard errors of the mean of at least three independent experiments. Data were analyzed using one-way ANOVA test and a Bonferroni post hoc test. Asterisks indicate values different from E1 wt. ***, P < 0.001; ****, P < 0.0001. (D) Presence of cell surface expression of HA-tagged chimeric proteins analyzed by IF. The RK-13 cells were transfected with the corresponding expression plasmids. At 24 h posttransfection, the cells were fixed with 4% PFA, permeabilized or left untreated, and then stained with α-HA/α-mouse FITC and analyzed by fluorescence microscopy.

