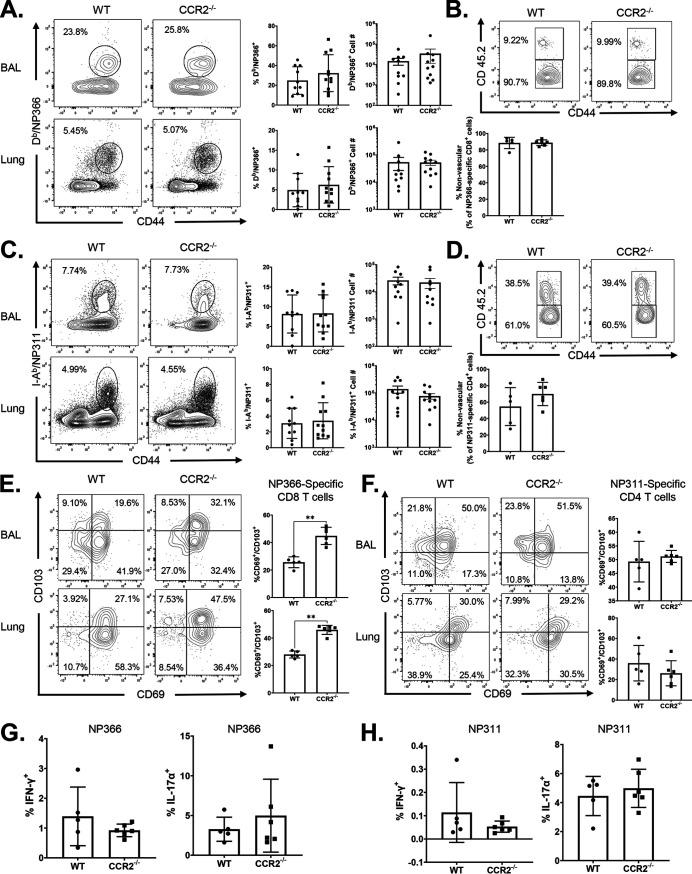
FIG 7.
Vaccine-induced CD8 and CD4 T cell memory in CCR2−/− mice. Wild-type (WT) and CCR2−/− mice were vaccinated as described in the legend to Fig. 2. At 60 days after booster vaccination, the percentages and total numbers of memory NP366-specific CD8 T cells (A) and NP311-specific CD4 T cells (C) were quantified in lungs and airways (BAL fluid). To distinguish nonvascular cells from vascular cells in the lungs, mice were injected intravenously with fluorescence-labeled anti-CD45.2 antibodies, 3 min prior to euthanasia (CD45.2+ve, vascular; CD45.2−ve, nonvascular). Single-cell suspensions from lungs or BAL fluid were stained with Db/NP366, I-Ab/NP311, anti-CD8, anti-CD44, anti-CD103, and anti-CD69. All FACS plots in this figure are gated on tetramer-binding CD8 or CD4 T cells. (A and C) Percentages and total numbers of NP366-specific CD8 (A) and NP311-specific CD4 (C) T cells in BAL fluid and lungs. (B and D) Percentages of vascular and nonvascular cells among NP366-specific CD8 (B) and NP311-specific CD4 (D) T cells. (E and F) CD69+ and/or CD103+ cells among NP366-specific CD8 (E) or NP311-specific CD4 (F) T cells in lungs. (G and H) Single-cell suspensions from lungs were cultured with or without NP366 (G) or NP311 (H) peptides in the presence of recombinant IL-2 and brefeldin A for 5 h. The percentages of NP366-specific CD8 T cells or NP311-specific CD4 T cells that produced IL-17α and/or IFN-γ were quantified by intracellular cytokine staining. Data in each graph are the mean ± SEM. Mann-Whitney U test; *, **, and *** indicate significance at P values of <0.05, <0.01, and <0.001, respectively. Each independent experiment had 3 to 6 mice per group. Data are pooled from two independent experiments (A and C) or represent one of two independent experiments (B, D, and E to H).

