Figure 1.
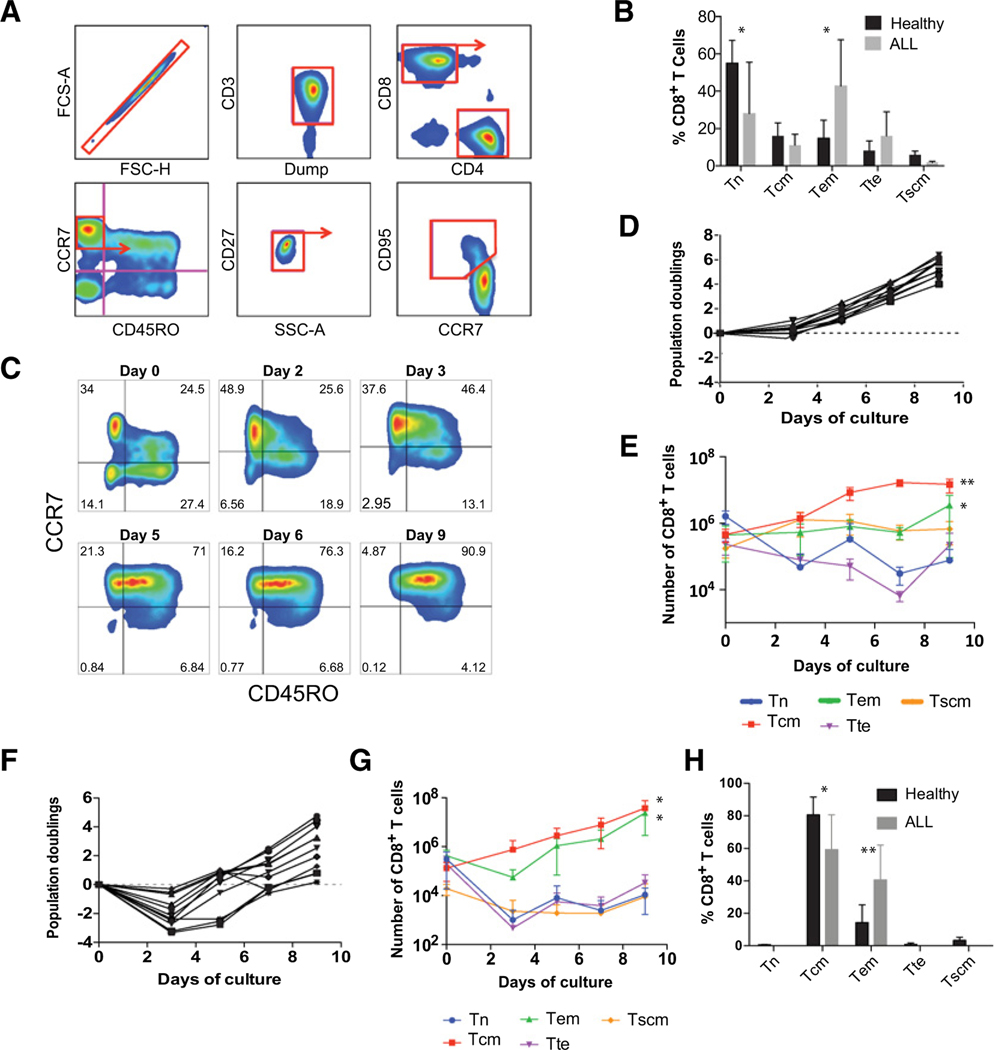
T cells progressively differentiate over time during ex vivo culture. A, Gating strategy used to identify Tn, Tscm, Tcm, Tem, and Tte subsets. The arrow identifies which subset was examined further. B, The proportion of CD8+ T-cell subsets freshly isolated from the peripheral blood of healthy donors (n = 9) and individuals with ALL (n = 9) calculated using the gating strategy shown in A. *, P < 0.05. C, Representative plots of CART19 cells at the specified timepoints during culture. Pregated for live CD3+CD8+ T cells as shown in A. D, Ex vivo proliferation of healthy donor T cells following stimulation with anti-CD3/CD28 microbeads. Total viable T cells were enumerated by flow cytometry using bead-based counting. Each donor is represented by a separate line. Dotted line: 0 population doublings. E, Absolute counts of CD8+ T cells subsets over time in cultures of healthy donors shown in D. Data are plotted as mean ± SD. **, P < 0.01;, P < 0.05 comparing d3 vs. d9. F, Ex vivo proliferation of T cells from ALL patients stimulated and enumerated as in D. G, Absolute counts of CD8+ T cells from ALL patients as shown in F. *, P < 0.05;, P < 0.05 comparing d3 vs. d9. H, The proportion of CD8+ T cells in healthy donors and ALL patients analyzed on day 9 of culture *, P < 0.05; **, P < 0.01. All comparisons were analyzed by Wilcoxon matched-pairs signed rank test.

