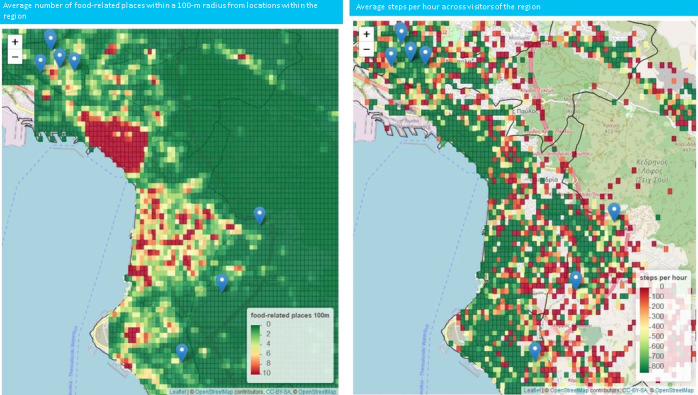
Figure 2.

Geohash distribution of food-related locations within a 100-meter radius from each geohash (left) and the steps per hour (right) for the city of Thessaloniki. Using mouseover, the user can access more information related to the number of contributors and the actual value in each geohash. Note: the geohash is visible only in cases where the aggregation was based on more than 5 contributions. The visual exploration reveals the high density of food-related places in the downtown of Thessaloniki and high activity among the children near the coastline of the city. The blue pins denote the location of schools. Source: OpenStreetMap [41].
