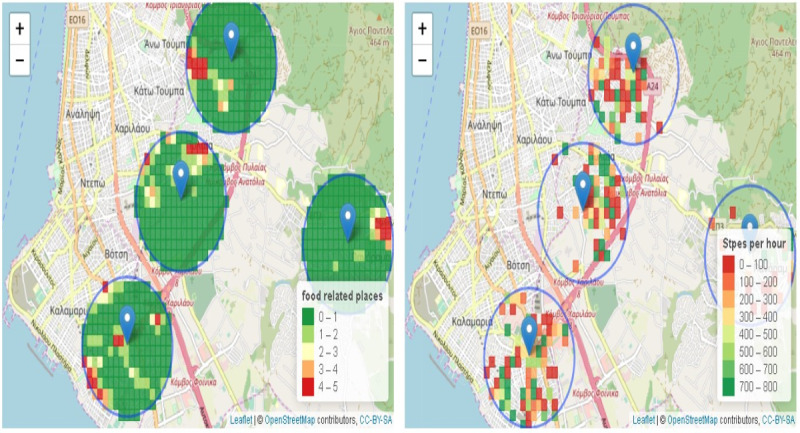
Figure 4.

An area of Thessaloniki where 4 schools are located (blue pins). The blue circles (1000-meter radius) define the regions under analysis close to schools. In the right image, the steps per hour for each geohash are depicted, whereas the density of food-related places for the same region is depicted on the left. Visual observation of the images revealed that there should exist a correlation between the density of food-related places close to schools and the steps per hour performed by the children in those areas. Source: OpenStreetMap [41].
