. 2021 Jul 12;129(7):076002. doi: 10.1289/EHP7381

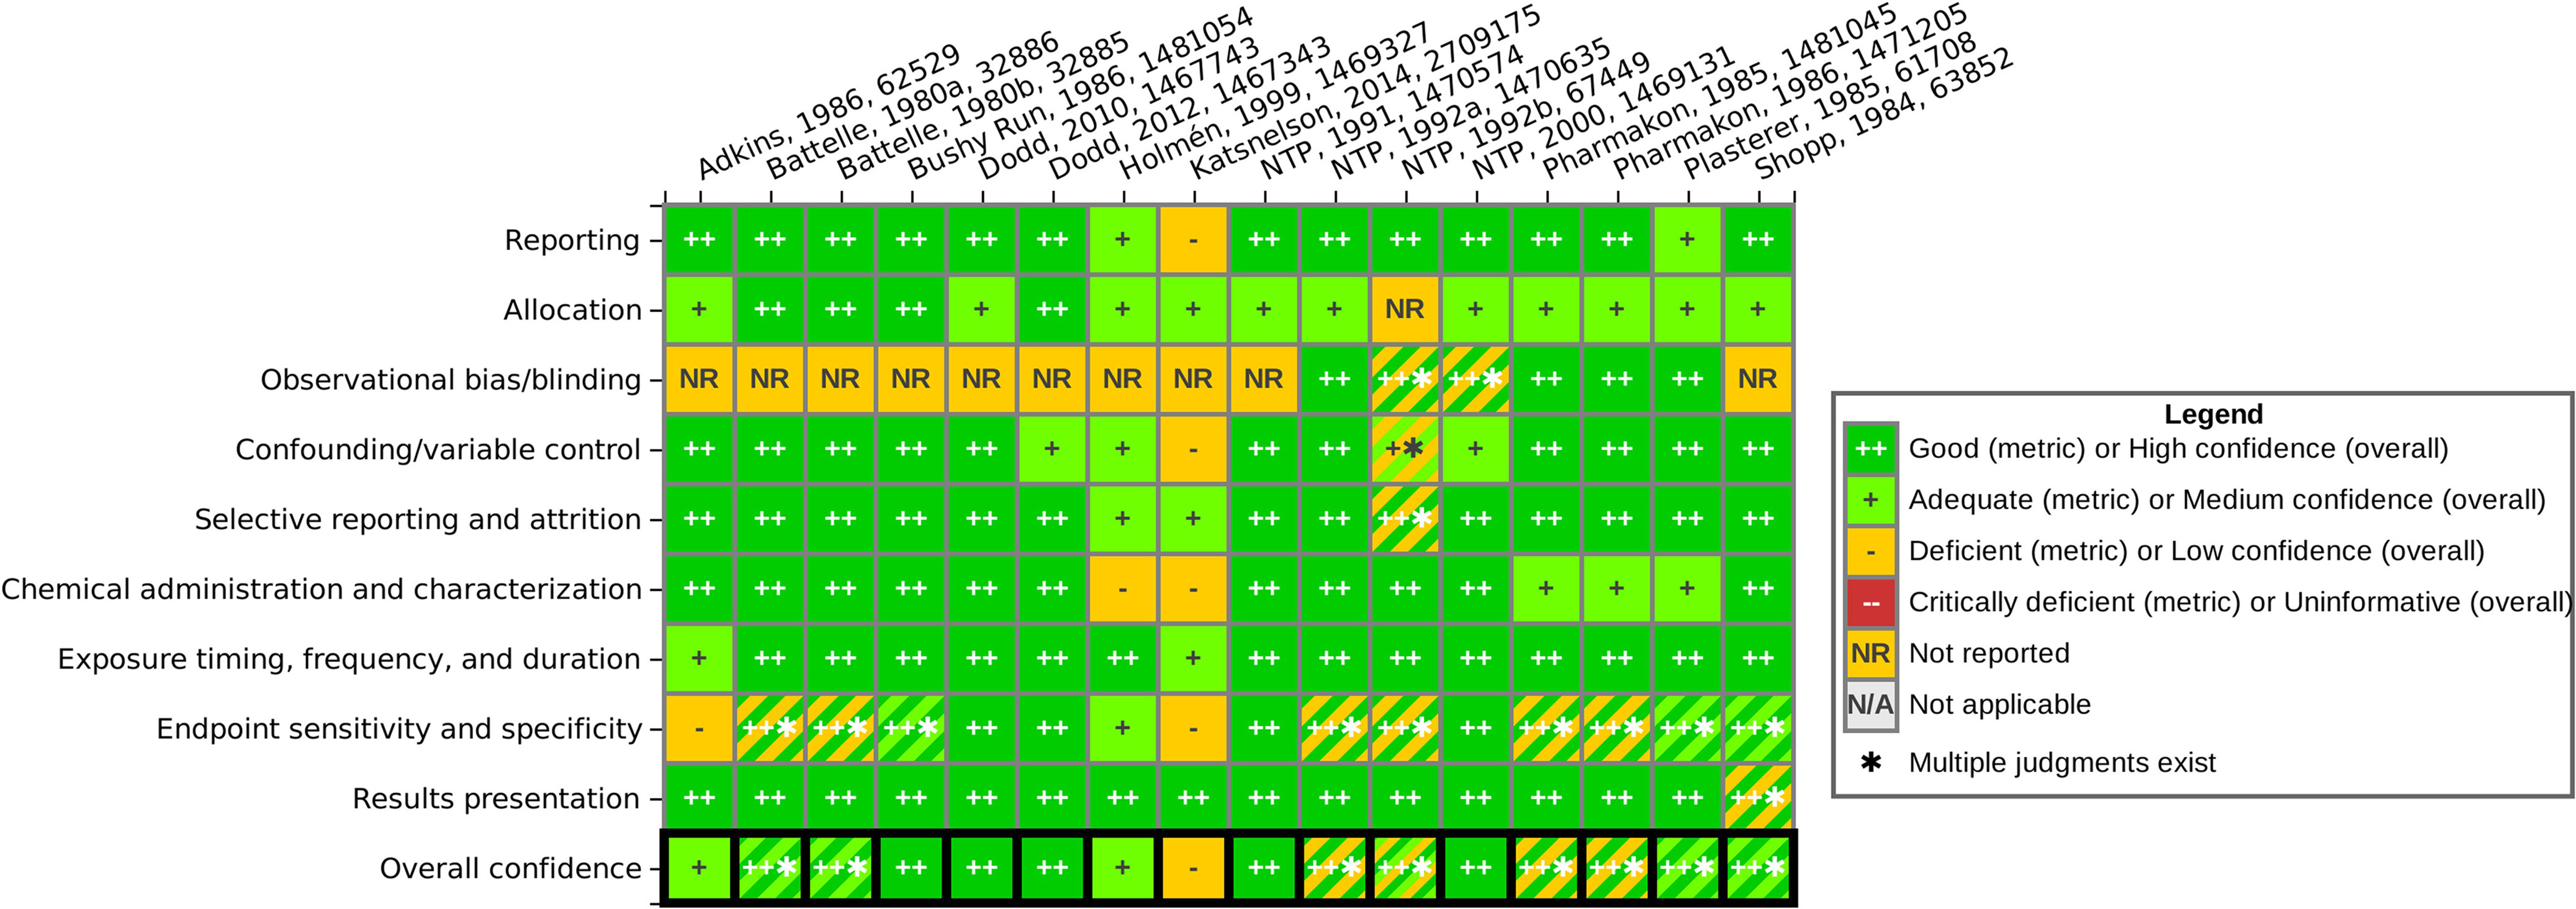
Figure 8.

Figure 8 is a heatmap of the animal study evaluation results. Study evaluation domains are plotted on the y-axis: reporting; allocation; observational bias or blinding; confounding or variable control; selective reporting and attrition; exposure timing, frequency, and duration; endpoint sensitivity and specificity; results presentation; and overall confidence. The individual studies are plotted on the x-axis: Adkins, 1989, 62529; Battelle, 1980a, 32886; Battelle, 1980b, 32885; Bushy Run, 1986, 1481054; Dodd, 2010, 1467743; Dodd, 2012, 1467343; Holmen, 1999, 1469327; Katsnelson, 2014, 2709175; NTP, 1991, 1470574; NTP, 1992a, 1470635; NTP 1992b, 67449; NTP 2000, 1469131; Pharmakon 1985, 1481042; Pharmakon 1985, 1471205; Plasterer, 1985, 61708; and Shopp, 1984, 63852. The plot shows the study evaluation results for each domain: good (metric) or high confidence (overall), adequate (metric) or medium confidence (overall), deficient (metric) or low confidence (overall), critically deficient (metric) or uninformative (overall), and not applicable.

Heat map of animal study evaluation results, listed by author, year, and HERO identification number. See interactive graphic in HAWC for ratings rationales: https://hawcprd.epa.gov/summary/visual/100500000/. Note: HAWC, U.S. EPA Health Assessment Workspace Collaborative; HERO, U.S. EPA Health & Environment Research Online.