
Figure 7: Optimization of CD4 and CD8 T cell effector differentiation by MOs.
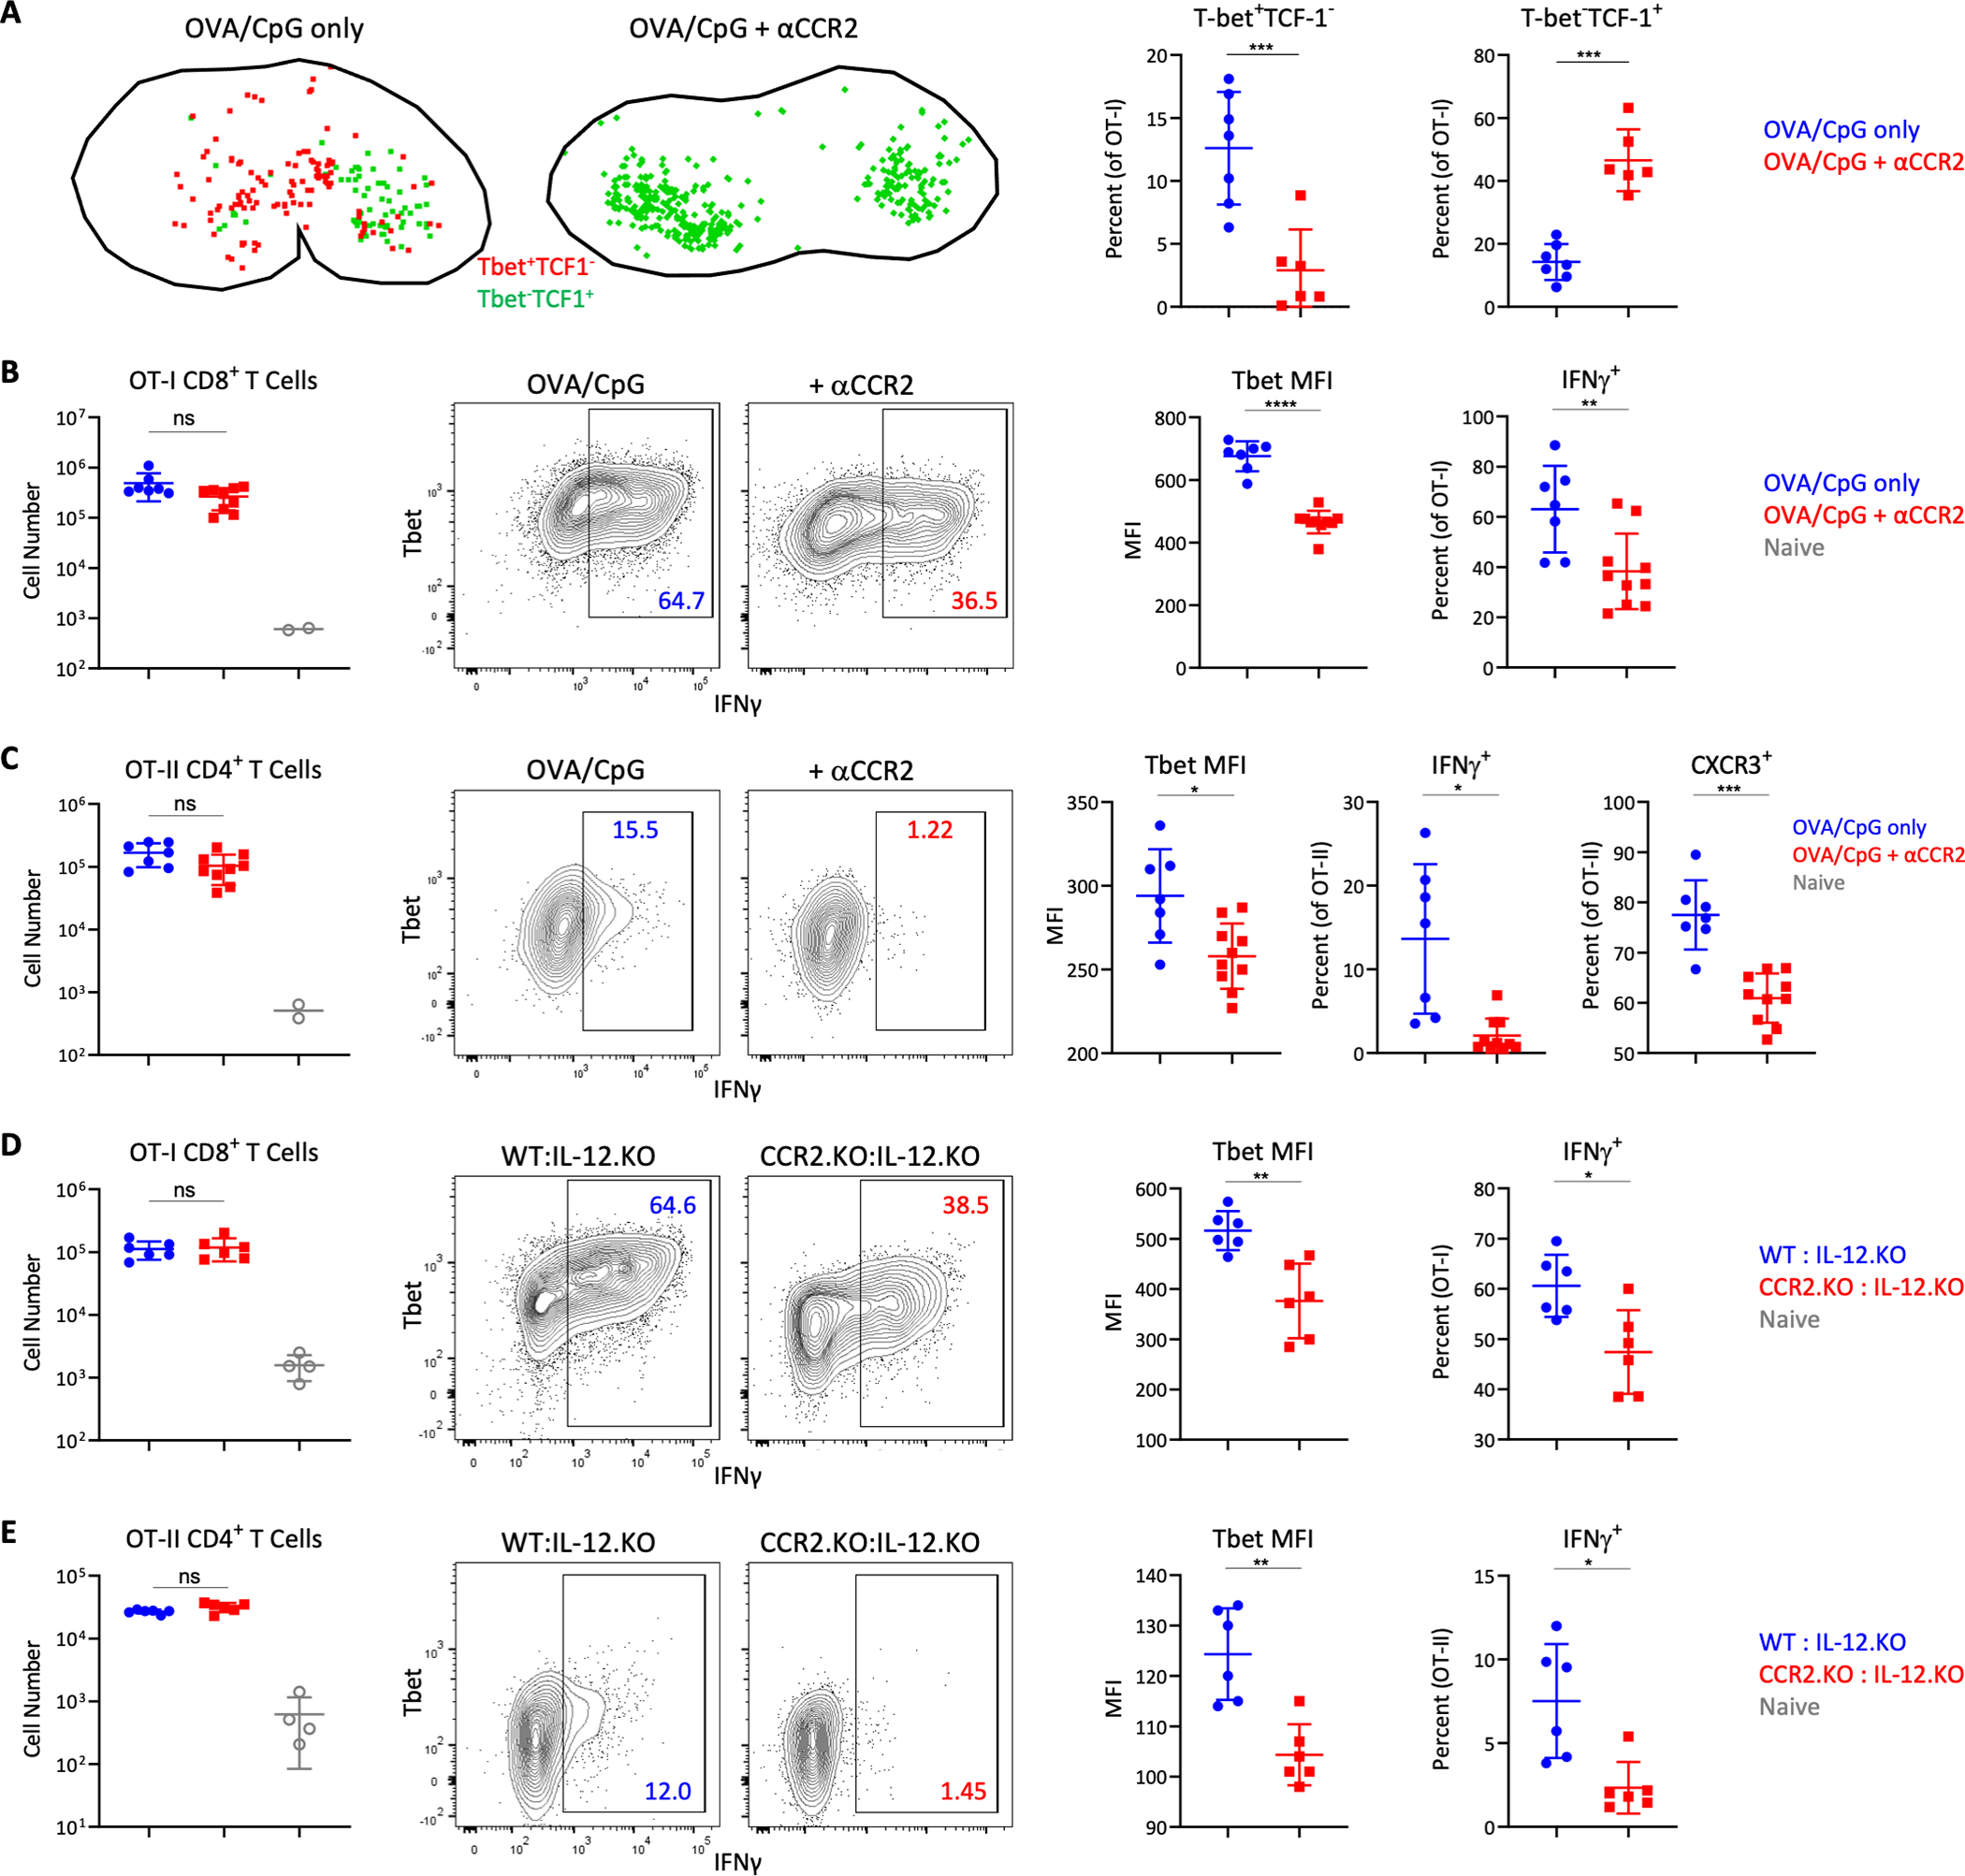
A) B6 mice were transferred with 106 OT-I T cells and immunized with CpG plus OVA in ears and footpads. Some animals were treated with αCCR2. dLNs were analyzed 1.75d later by histocytometry for location (left) and frequency (right) of Tbet+TCF1- and Tbet-TCF1+ OT-I cells. B-C) B6 mice were co-transferred with 105 OT-I and OT-II T cells and immunized with CpG plus OVA in the ears. Some mice were treated with αCCR2. dLNs were analyzed 4d later by flow cytometry. Total CD44+ cells, Tbet geometric MFI, percentage of IFNγ+ Τ cells following restimulation, and percent CXCR3+ for B) OT-I and C) OT-II cells. D-E) WT:IL-12p40.KO and CCR2.KO:IL-12p40.KO mixed BMCs were co-transferred with 105 OT-I and OT-II T cells and immunized with CpG plus OVA 1d later. D) OT-I and E) OT-II cellularity and differentiation in dLNs was assessed by flow cytometry 4d later. Data analyzed by unpaired t test with Welch’s correction. Data represent at least 2 independent experiments.