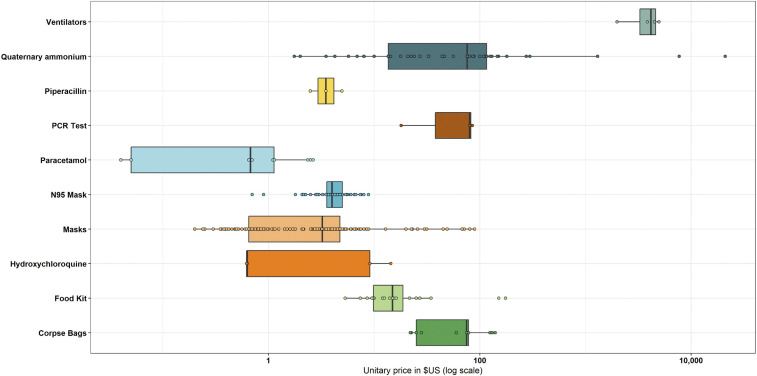
Figure 1.
Price distribution of basic supplies related to the COVID-19 response in Ecuador (March 1–July 31, 2020). The plot depicts variations in price by item compared with the median/mean price, using as reference outliers in distribution in a logarithmic scale. Dots outside bars and boxes represent extreme and atypical values.

