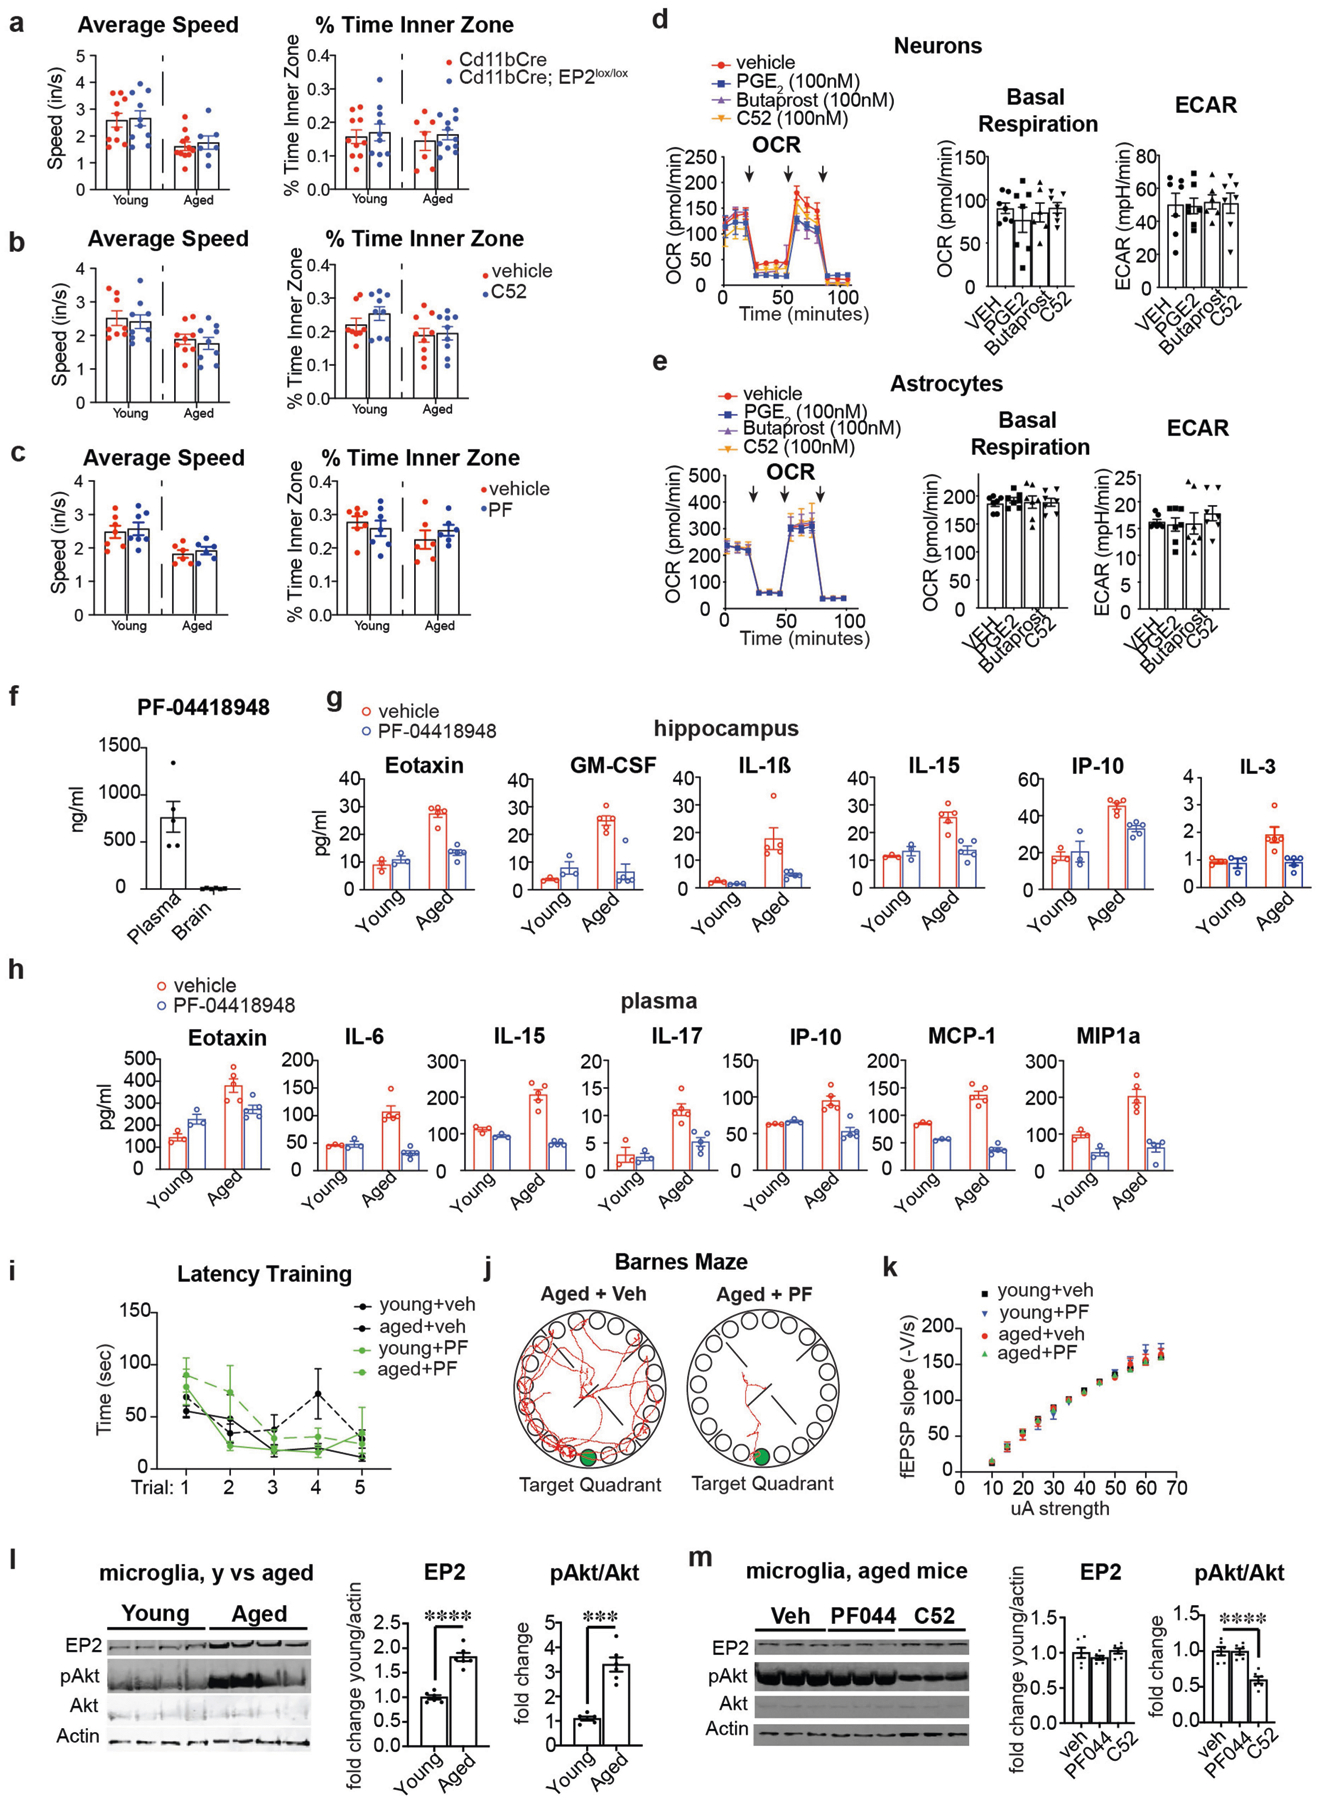
Extended Data Fig. 9 |. Peripheral EP2 blockade restores youthful inflammatory profile and cognitive status.

Data are mean ± s.e.m. unless otherwise specified. a, Average speed (inches per second) and percentage of time spent in the inner zone in young (3–4 months) and aged (20–23 months) Cd11bCre;EP2lox/lox mice. There are no significant differences between age-matched Cd11bCre and Cd11bCre;EP2lox/lox mice (n = 10 mice (young); n = 7 mice (aged Cd11bCre;EP2lox/lox); n = 11 mice (aged Cd11bCre)). b, Average speed (inches/second) and percentage of time spent in the inner zone in young (3–4 months) and aged (22–24 months) mice treated with C52 compound (10 mg/kg/d, 1 month). There are no significant differences between age-matched vehicle and C52-treated mice (n = 8 mice for young + veh; n = 9 mice per group for all other groups). c, Average speed (inches per second) and percentage of time spent in the inner zone in young (3–4 months) and aged (20–22 months) mice treated with PF compound (2.5 mg/kg/d, 6 weeks.) There are no significant differences between age-matched vehicle or PF-treated mice (n = 7 mice for young groups; n = 6 mice for aged groups). d, Real-time changes in OCR and quantification of basal respiration and ECAR of three independent experiments on mouse hippocampal neurons treated with PGE2 (100 nM, 20 h), butaprost (100 nM, 20 h) and C52 (100 nM, 20 h) (n = 6 (butaprost), n = 7 (all others) biologically independent samples per group). Black arrows represent addition of oligomycin (1 μM), FCCP (2 μM), and rotenone/antimycin (500 nM), respectively, at time points indicated. e, Real-time changes in OCR and quantification of basal respiration and ECAR of three independent experiments on mouse astrocytes treated with PGE2 (100 nM, 20 h), butaprost (100 nM, 20 h) and C52 (100 nM, 20 h) (n = 7 biologically independent samples per group). Black arrows represent addition of oligomycin (1 μM), FCCP (2 μM), and rotenone/antimycin (500 nM), respectively, at time points indicated. f, LC–MS analysis of plasma and brain levels of PF-04418948 (2.5 mg/kg/d, 6 weeks). PF-04418948 was not detected in whole-brain lysates of treated mice (n = 5–6 mice per group, 20–22 mo). g–k, Young (3–4 months) and aged (20–22 months) mice were treated with vehicle or PF-04418948 at 2.5 mg/kg/d for 6 weeks. g, Quantification of significantly regulated immune factors in hippocampi (n = 3 young mice; n = 5 aged mice per group). h, Quantification of significantly regulated immune factors in plasma (n = 3 young mice; n = 5 aged mice per group). i, Primary latency in the Barnes maze for the five learning trials (n = 7 young mice; n = 6 aged mice per group). j, Representative traces of paths taken to the target hole (green) on the day of testing in the Barnes maze comparing aged mice with or without PF-04418948. k, Input/output curves as a measure of basal synaptic transmission in the CA1 region of the hippocampus (n = 8 slices, 3 mice per group). l, Microglia were isolated from brains of young (2–3 months) and aged (20–22 months) mice and assayed for EP2 receptor, pAKT and total AKT levels. Left, representative western blot; right, quantification. Two-tailed Student’s t-test, ***P < 0.001, **** P < 0.0001 (n = 6 mice per group). m, Microglia were isolated from brains of aged (20–24 months) mice treated with vehicle, PF-04418948 (10 mg/kg/day for 10 days) or C52 (10 mg/kg/day for 10 days). Left, representative western blot; right, quantification with two-tailed Student’s t-test, **** P < 0.0001 (n = 6 mice per group).
