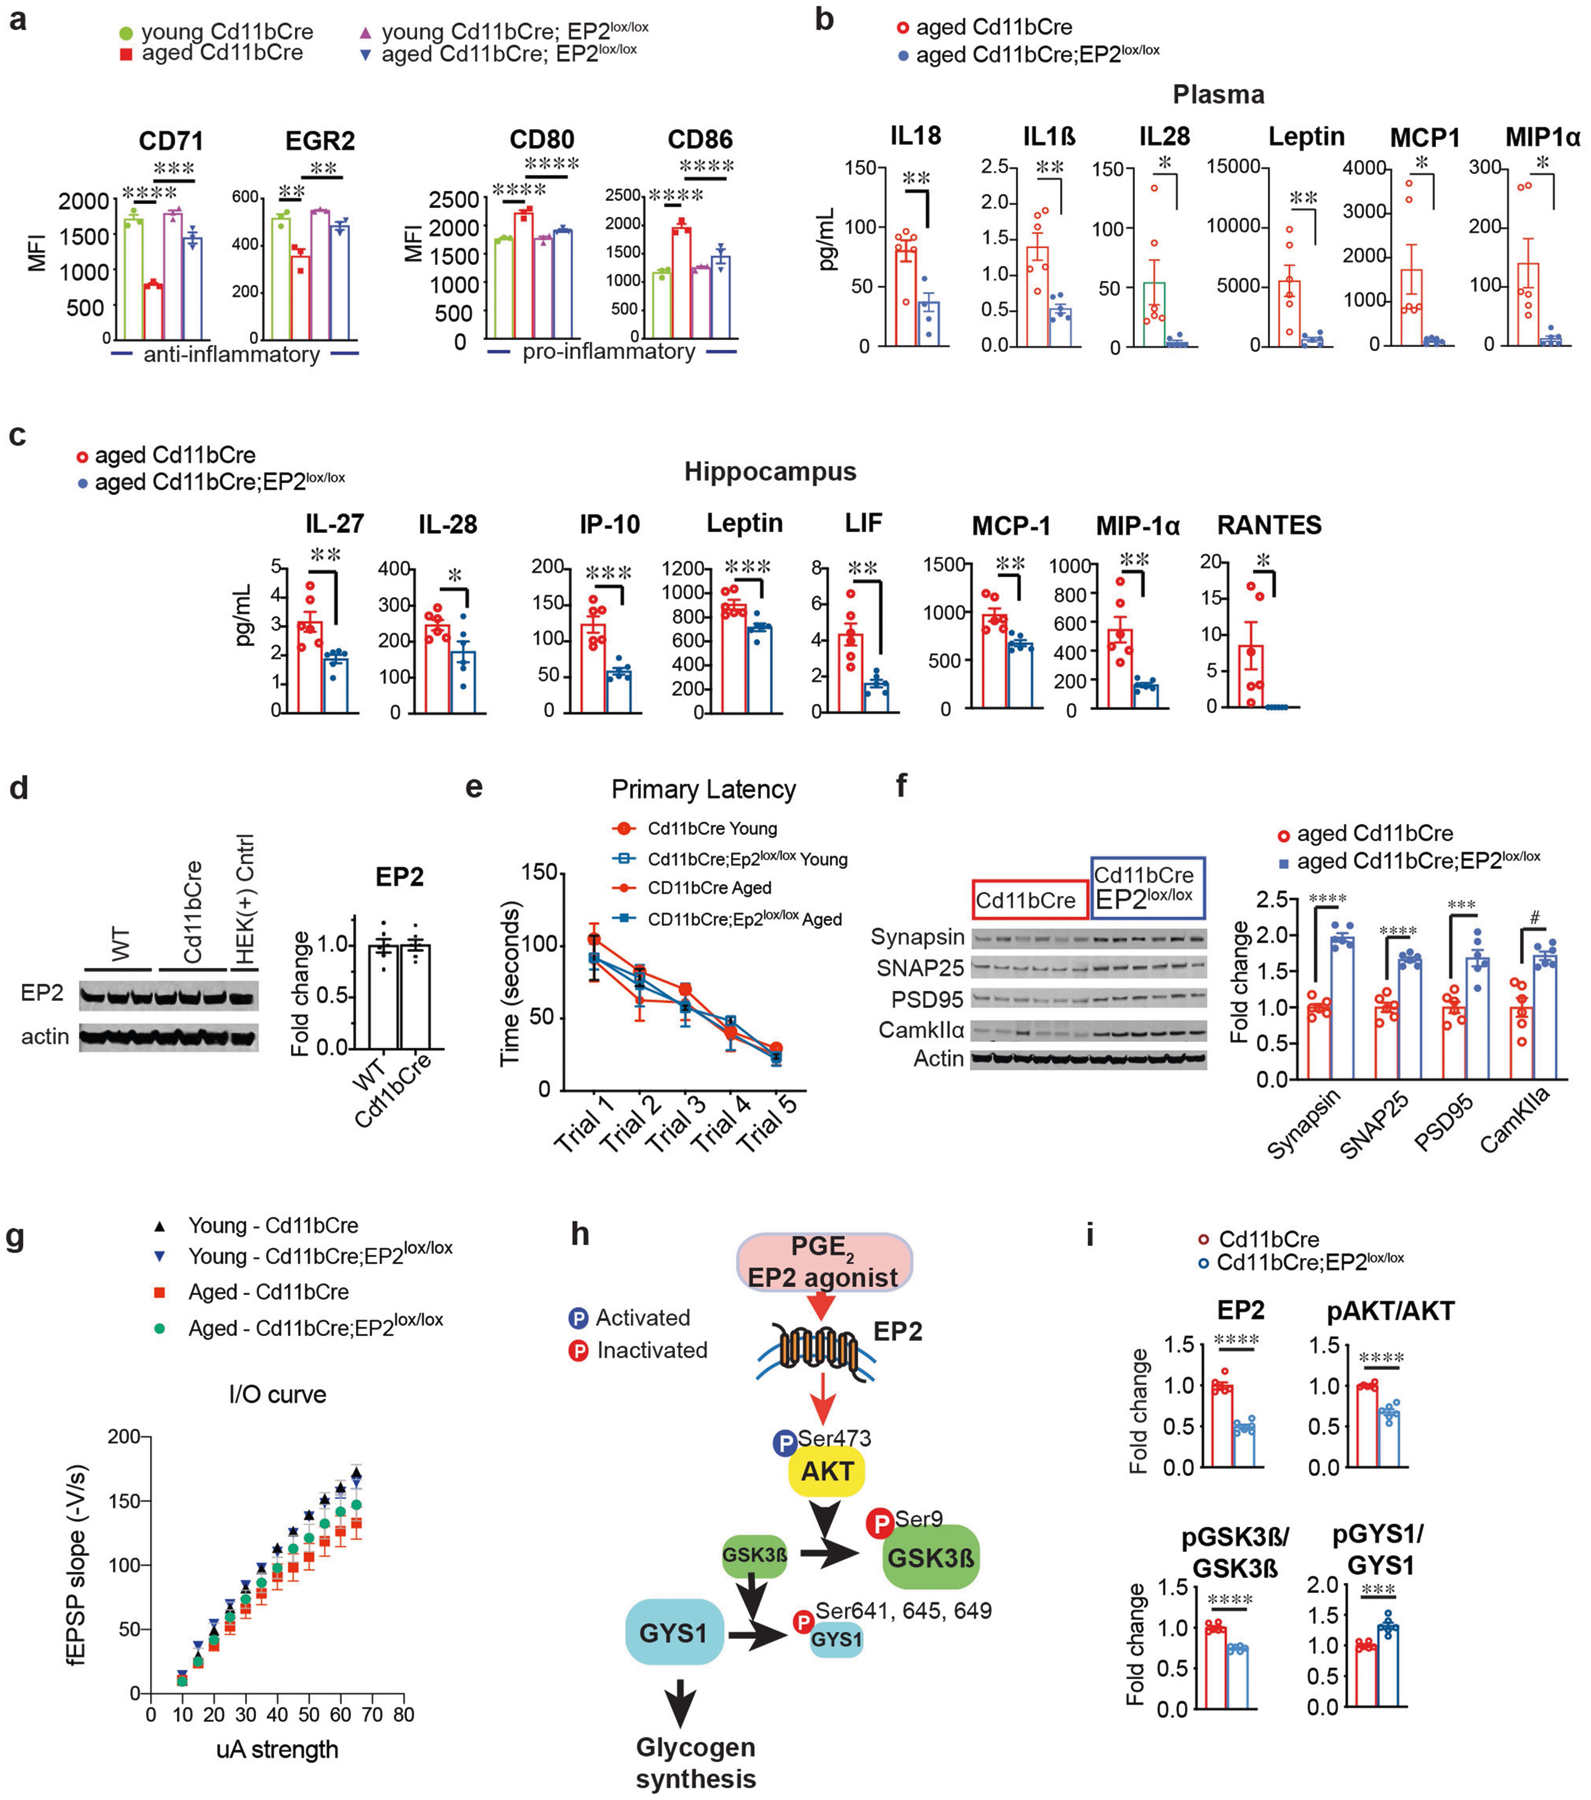
Extended Data Fig. 2 |. Myeloid EP2 receptor knockdown prevents age-associated inflammation.

Data are mean ± s.e.m. unless otherwise specified. a, MFI quantification from three independent experiments for the anti-inflammatory markers CD71 and EGR2 and pro-inflammatory markers CD80 and CD86 in young (3–4 months) and aged (20–23 months) Cd11bCre and Cd11bCre;EP2lox/lox mice (n = 10,000–20,000 cells per point; n = 3 mice per group). Two-way ANOVA: effects of genotype and age P < 0.0001; Tukey’s post hoc test **P < 0.01, ***P < 0.001, ****P < 0.0001. b, c, Quantification of immune factors in plasma (b) and hippocampus (c) comparing aged Cd11bCre and aged Cd11bCre;EP2lox/lox mice; *P < 0.05, **P < 0.01 by two-tailed Student’s t-test (n = 6 mice per group). d, Representative immunoblot and quantification from two independent experiments comparing EP2 levels in 6-month-old Cd11bCre and wild-type mice (n = 6 per group). e, Primary latency in the Barnes maze for the five learning trials (n = 10 (young), n = 11 (aged Cd11bCre), n = 7 (aged Cd11bCre;EP2lox/lox). f, Representative immunoblot and quantification of hippocampal presynaptic proteins synapsin and SNAP-25 and postsynaptic proteins PSD95 and CamKIIα; #P = 0.0005, ***P = 0.0006, ****P < 0.0001 by two-tailed Student’s t-test (n = 6 mice per group; 20–23-month-old mice). g, Input/output curves as a measure of basal synaptic transmission in the CA1 region of the hippocampus (n = 8 slices, 3 mice per group). h, PGE2 activation of the EP2 receptor activates AKT signalling through phosphorylation of Ser473. Activated pAKT (Ser473) inactivates GSK3β through inhibitory phosphorylation of Ser9. Inactivation of GSK3β leads to constitutive activity of glycogen synthase 1 (GYS1) and glycogen synthesis. Conversely, deletion or antagonism of EP2 receptor signalling leads to downstream inhibitory phosphorylation of Ser641, Ser645 and Ser649 on GYS1 by activated, non-phosphorylated GSK3β. i, Quantification of EP2, pAKT (Ser 473)/total AKT, pGSK3β (Ser9)/total GSK3β and pGYS1 (Ser 641, 645, 649)/GYS1 levels in peritoneal macrophages from 6-month-old Cd11bCre and Cd11bCre;EP2lox/lox mice; ***P = 0.0002, ****P < 0.0001 by two-tailed Student’s t-test (n = 6 mice per group).
