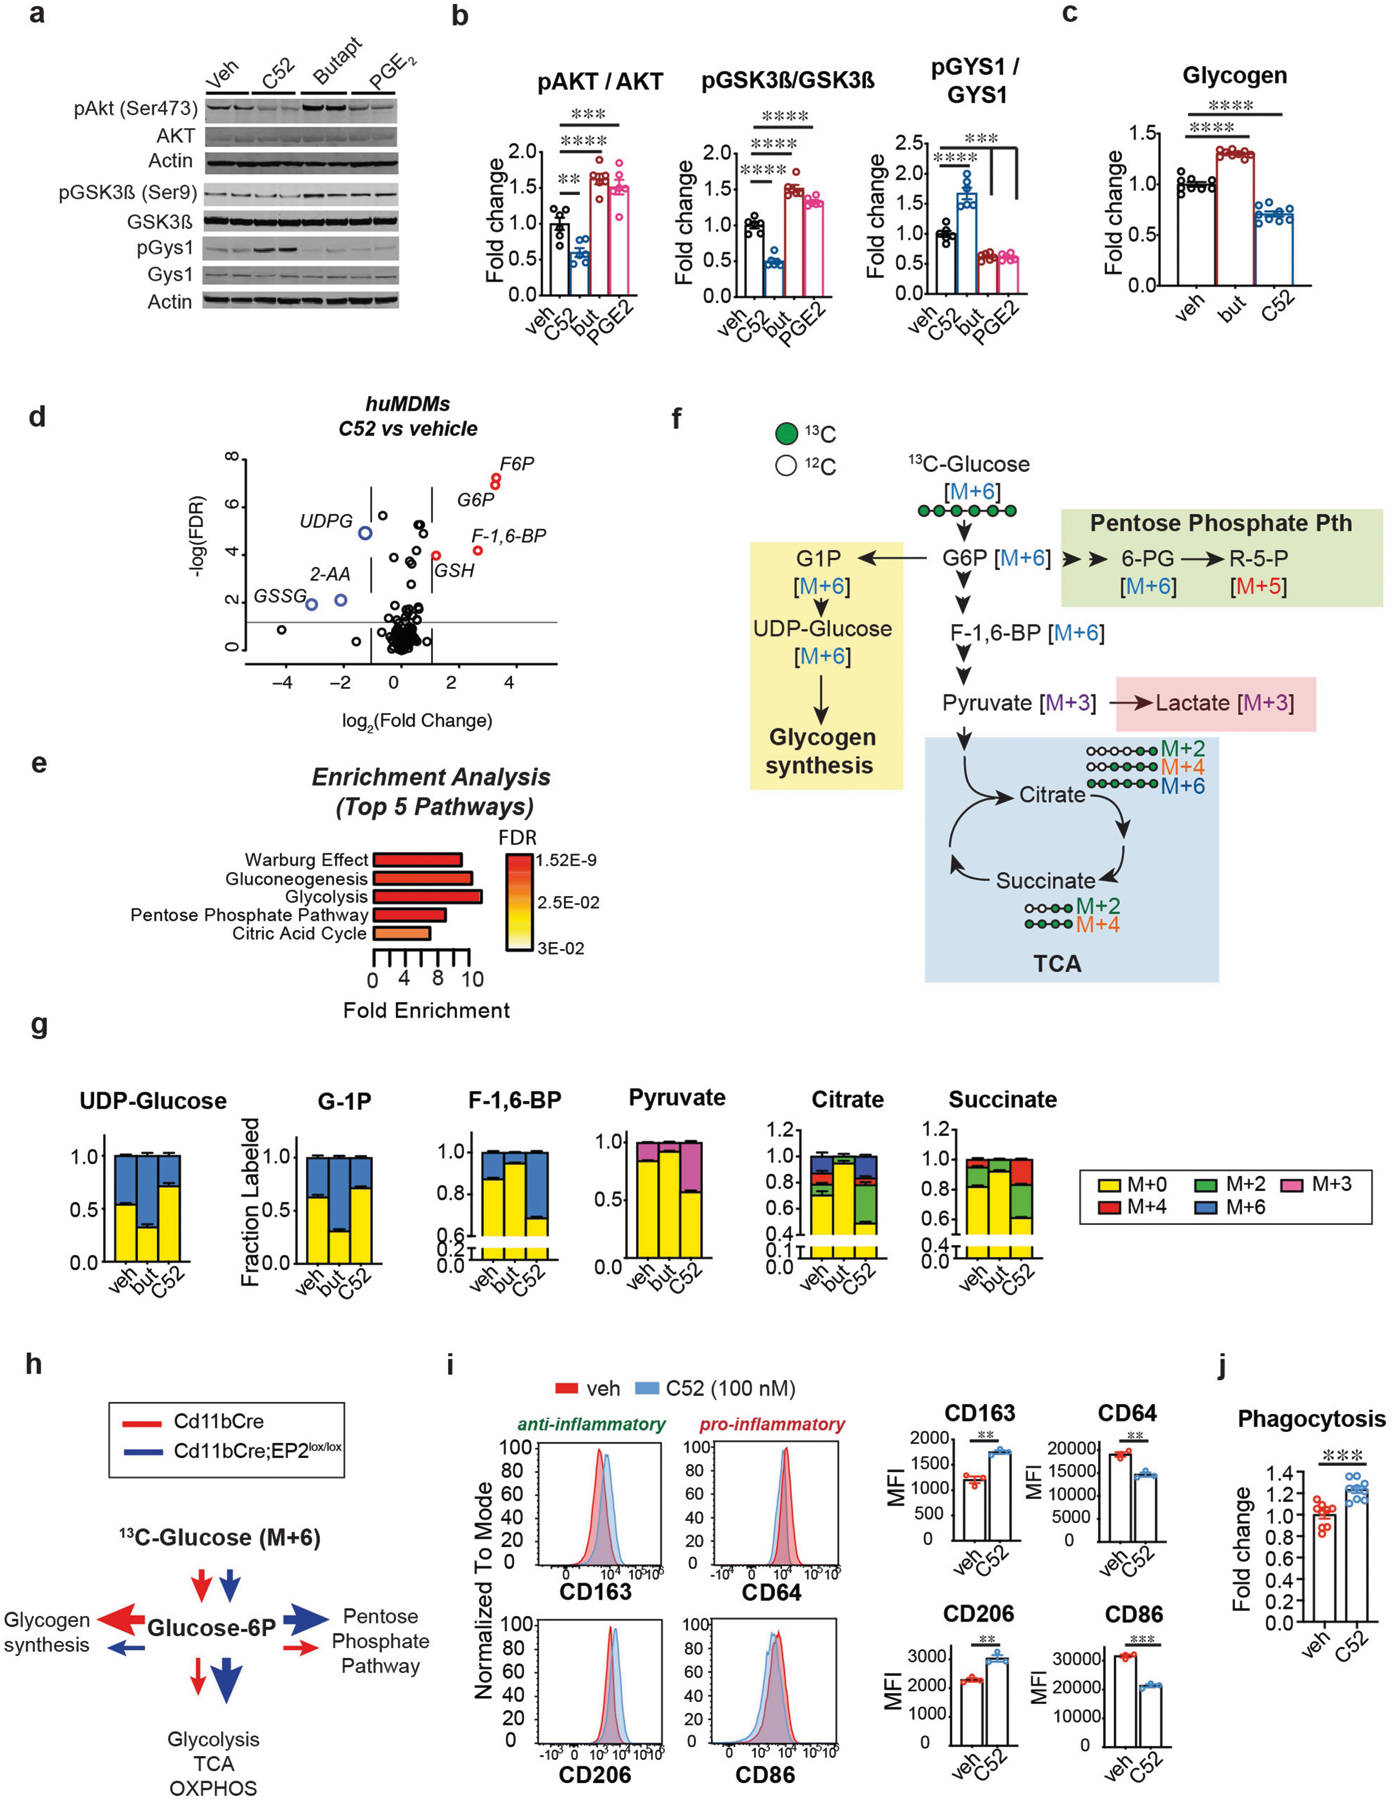
Extended Data Fig. 3 |. Macrophage EP2 signalling increases glycogen synthesis.

Data are mean ± s.e.m. unless otherwise specified. a, Representative immunoblots and quantification of the EP2–AKT–GSK3β–GYS1 signalling pathway in mouse peritoneal macrophages isolated from 6-month-old wild type C57B6/J mice treated with EP2 antagonist C52 (100 nM), EP2 agonist butaprost (100 nM) or PGE2 (100 nM) for 20 h. b, Quantification of a; P < 0.0001 by one-way ANOVA; Tukey’s post hoc test **P = 0.0072, ***P < 0.001, ****P < 0.0001 (n = 6 mice per group). c, Quantification of glycogen levels in human MDMs (age (mean ± s.e.m.) 43.9 ± 3.451 years) treated with EP2 agonist butaprost (100 nM) or EP2 antagonist C52 (100 nM) for 20 h. P < 0.001 by one-way ANOVA; Tukey’s post hoc test ****P < 0.0001 (n = 9 per group). d, LC–MS analysis of human MDMs (age (mean ± s.e.m.) 43.9 ± 3.451 years) treated with C52 (100 nM, 20 h) demonstrates upregulation of proximal glycolytic pathway (G6P, F6P, F-1,6-BP) and GSH and downregulation of UDPG and GSSG. Red circles represent metabolites with fold change >1.5, blue circles with fold change <1.5; q-value < 0.05 with false discovery rate (FDR) correction (n = 6 donors per group). e, Enrichment pathway analysis of d using MetaboAnalyst. f, Schematic depicting U-13C-glucose metabolism via glucose-1P (G1P) and UDP-glucose to glycogen synthesis (yellow shaded box) versus flux towards the pentose phosphate pathway (green shaded box), glycolysis or lactate, and the TCA cycle (blue shaded box) with associated mass-labelled molecules. Glucose is labelled at all 6 carbons (in green; M+6) and is converted via the glycolytic pathway to two molecules of pyruvate (or M+3). Pyruvate is transported into the mitochondria and undergoes oxidative decarboxylation to yield acetyl-CoA (M+2) which enters the TCA cycle. Successive additions of labelled acetyl-CoA through the TCA cycle yield M+2, M+4 and M+6. g, Isotope tracing of U-13C-glucose metabolism was performed in human MDMs (age (mean ± s.e.m.) 42.13 ± 3.674 years) treated with EP2 agonist butaprost (100 nM, 20 h) or EP2 inhibitor C52 (100 nM, 20 h; n = 6 donors per group). Activation of EP2 signalling with butaprost increases incorporation of heavy glucose in glycogen precursors G1P and UDP-glucose and reduces labelling of glycolytic intermediates (F-1,6-BP and pyruvate) as well as TCA cycle intermediates (citrate and succinate); inhibition of EP2 with C52 conversely reduces synthesis of glycogen precursors and increases glycolytic and TCA cycle intermediates. h, Schematic depicting changes in glucose metabolism in Fig. 2h, i. i, Representative flow cytometry histograms and corresponding MFI quantification of human MDMs with or without the EP2 inhibitor C52 (100 nM, 20 h) from three independent experiments. Surface levels of anti-inflammatory markers CD206 and CD163 increase with inhibition of EP2 signalling whereas levels of pro-inflammatory markers CD86 and CD64 decrease. **P < 0.01, ***P = 0.002 by two-tailed Student’s t-test (n = 30,000 – 40,000 cells per point; n = 3 donors per group). j, Quantification of phagocytosis of fluorescent E. coli particles in human MDMs treated with EP2 inhibitor C52 (100 nM, 20 h) from two independent experiments. ***P = 0.0002 by two-tailed Student’s t-test (n = 9 donors per group).
