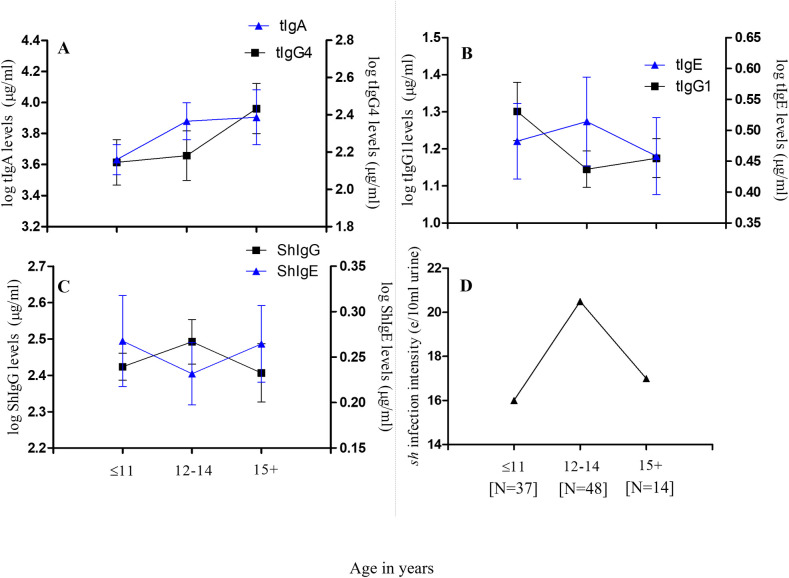
Fig 5.
Stratification of measured plasma antibody levels by age among S. haematobium-infected participants (N = 99): (A) Mean total IgA (tIgA) and tIgG4 titres by age groups; (B) Mean titres of tIgE and tIgG1 by age groups. Error bars represent the standard error of mean (SEM). (C) Mean titres of S. haematobium-specific Schistosoma egg antigen (ShSEA)–IgE and ShSEA-specific IgG by age groups; and (D) GM S. haematobium infection intensity distribution by age groups among infected participants. [N] denotes the number of pupils in each age group.

