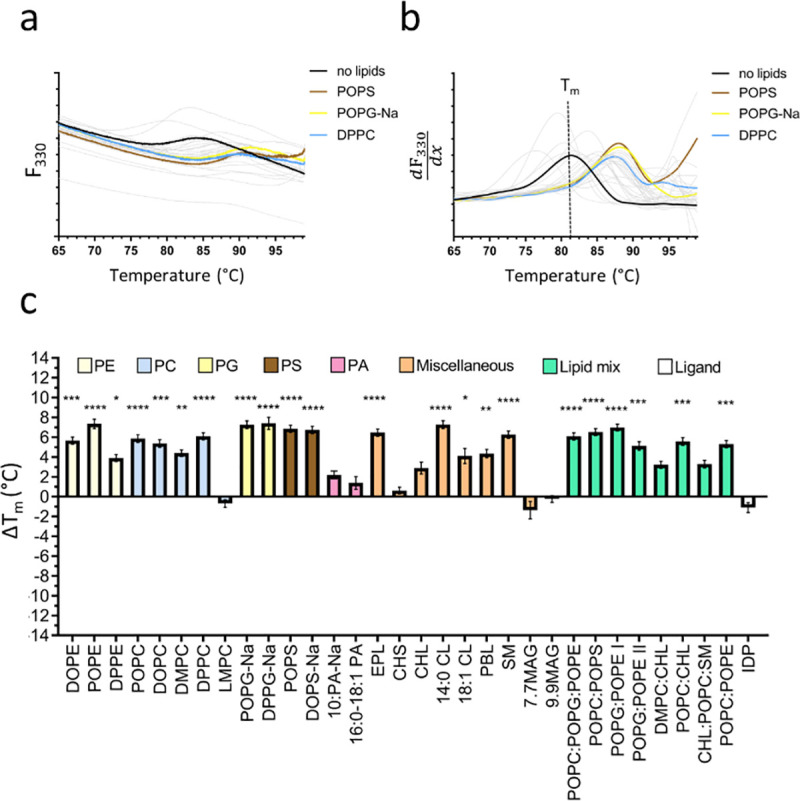
Fig 3. Lipid screening of Tm-PPase by nanoDSF.

(a) F330 signal of the no lipids reference sample (black line) and a representative set of stabilising lipids (coloured lines) during the melting scan. Grey lines show the fluorescence traces of the other tested lipids. (b) First derivative of the F330 signal highlighting the fluorescence change indicative of protein unfolding. The Tm can be determined at the curve peak, here shown for the no lipids reference sample as dotted line. (c) ΔTm of detergent-solubilised to relipidated sample shown for all tested lipids, which are sorted and colour coded according to their lipid class. Panel a-b show the traces of a representative nanoDSF scan. Panel c shows the ΔTm and corresponding SEM based on three technical repeats. The asterixis represent the p-value (* = 0.0332, ** = 0.021, *** = 0.002, **** = 0.0001) obtained by a one-way ANOVA followed by a Dunnet test to correct for multiple comparison in GraphPadPrism 7.
