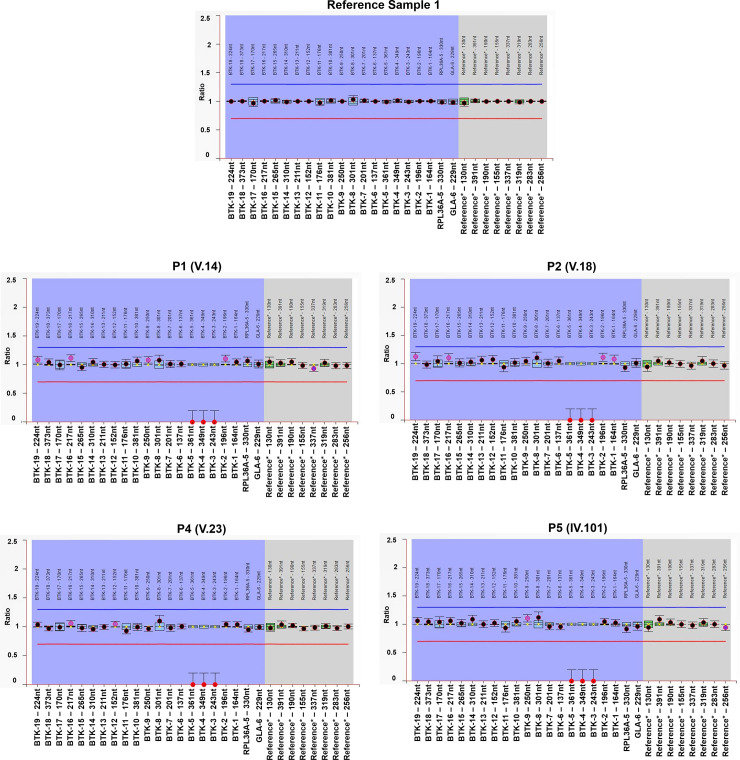
Fig 3. Multiplex ligation dependent amplification (MLPA) assay for detection of deletion encompassing 3–5 exons of the BTK gene: Representation of ratio charts generated using the Coffalyser.net software.
(A) Reference sample depicts the normal copies of the BTK gene and other samples (B) Sample P1 (C) Sample P2 (D) Sample P4 (E) Sample P5 are all males and depict probe ratio of zero for 3–5 exons of the BTK gene which lies on X-chromosome, i.e. they have hemizygous deletion. For all the ratio charts, the longitudinal axis (X-axis) represents the final ratios after inter and intra normalisations of the probe ratios. Horizontal axis (Y-axis) represents the probe names alongwith the length in the order (Both axis title have been manually enlarged for clarity). The blue and red horizontal lines depict the arbitrary borders of ratio 1.3 and 0.7 respectively. The black and red dots denote the final ratio obtained for each of the probes and the vertical bars represent the 95% confidence range for each probe. The Roman and numeric numbers on top of each ratio chart represent the individual marked as per the pedigree in Fig 1.

