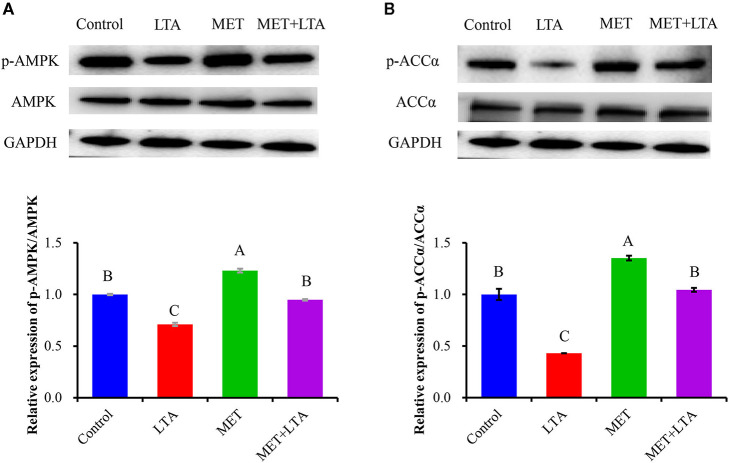
Figure 3.
Expression of proteins related to the AMPK signaling pathway. The expression of AMPK signaling–related proteins was measured by Western blot analysis in PBMECs treated with metformin 3 mM for 12 h, and LTA (100 μg/mL) for 6 h. Graphs show densitometric analysis (expressed as P-AMPK ratio to AMPK and P-ACC to ACC) from each band from three independent experiments. Values represent means ± SEM. LTA, lipoteichoic acid; MET, metformin. Different uppercase letters (A–C) on the top of bars indicate significant differences (n = 3, p < 0.05) vs. among the groups. This study measured the phosphorylation of both (A) AMPK and (B) ACC expression level.

