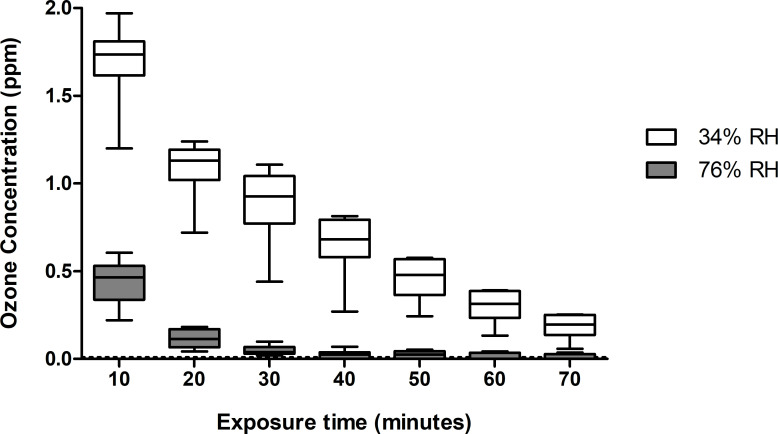
Fig 1. Ozone concentrations measured at 34% and 76% RH at 10-min intervals over a maximum exposure time of 70 min.
The boxes at 10 minutes of exposure represent a total of 18 readings for both RHs. Boxes at 20, 30 and 40 min represent twelve readings each and boxes at 50, 60 and 70 min represent six readings each.

