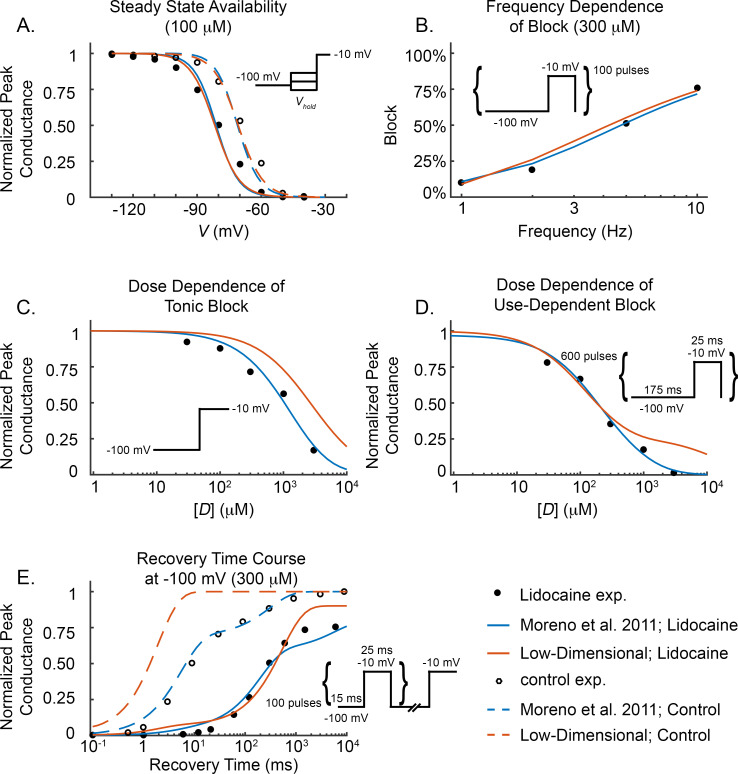
Fig 3. Lidocaine voltage-clamp data.
Experimental voltage-clamp data (filled circles), Moreno et al. 2011 model fit (solid blue curves), low-dimensional model output (solid orange curves) for lidocaine effects on the Na+ conductance. V-clamp data for control, i.e. no drug, experiments (open circles), Moreno et al. (blue dashed curves), and low-dimensional model with no drug (orange dashed curves) are included for appropriate protocols. (A) Steady state availability with SSE of 3.6×10⁻³ and 2.9×10⁻³ for the Moreno et al. and low-dimensional lidocaine models, respectively. (B) Frequency dependence of block with SSE of 8.8×10⁻⁴ and 1.7×10⁻³ for the Moreno et al. and low-dimensional lidocaine models, respectively. (C) Tonic block with SSE of 3.1×10⁻³ and 0.033 for the Moreno et al. and low-dimensional lidocaine models, respectively. (D) Dose-dependence of use-dependent block with SSE of 1.3×10⁻³ and 1.1×10⁻² for the Moreno et al. and low-dimensional lidocaine models, respectively. (E) Recovery from use-dependent block with SSE of 2.3×10⁻³ and 5.0×10⁻³ for the Moreno et al. and low-dimensional lidocaine models, respectively. n is total number of data points, {yi} are the model output, and {xi} are the experimental data values [9,10,17].

