Figure 6.
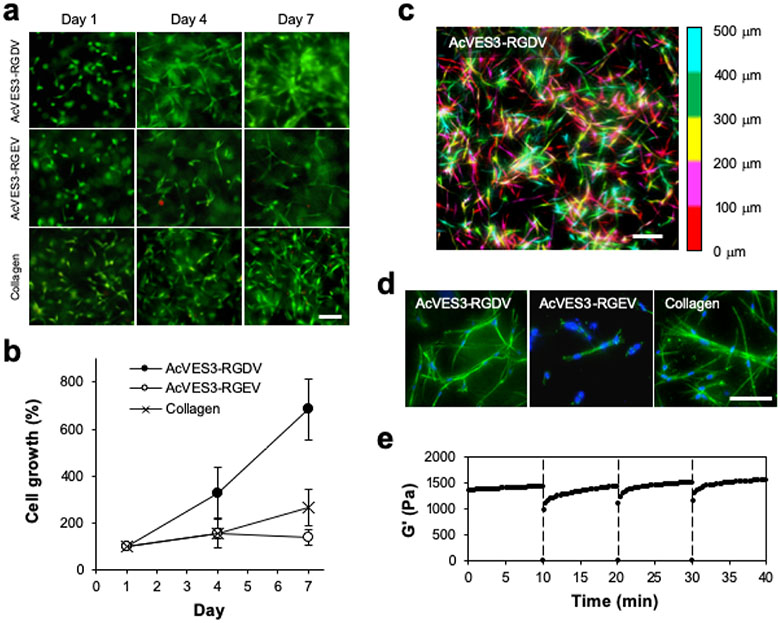
HDF cells were encapsulated and 3D-cultured within 0.5 wt % peptide gels or 0.3 wt % collagen gels. (a) Live and dead cells were visualized on days 1, 4, and 7, using calcein AM and ethidium homodimer-1 staining, respectively (scale bar = 100 μm). (b) Cell proliferation was monitored by quantifying cell viability using a WST-8 assay on days 0, 1, and 4. Data are represented as mean ± SD of three independent replicates. (c) A pseudo-colored composite of a Z-stacked image (500 μm) of live cells stained with calcein AM encapsulated within a 0.5 wt % AcVES3-RGDV gel at day 4 of culture. The depths are colored red (0–100 μm), magenta (100–200 μm), yellow (200–300 μm), green (300–400 μm), and cyan (400–500 μm); scale bar = 100 μm. (d) Z-stack image of cytoskeleton organization in the gels on day 4 of culture with actin-stained green and nuclei stained blue, scale bar = 100 μm. (e) Shear-thin/recovery of a 0.5 wt % AcVES3-RGDV gel containing cells that had been 3D-cultured for 4 days. Gels were shear-thinned at 1000% strain for 30 s (indicated by dashed line) every 10 min and allowed to recover by reducing the strain to 0.2%.

