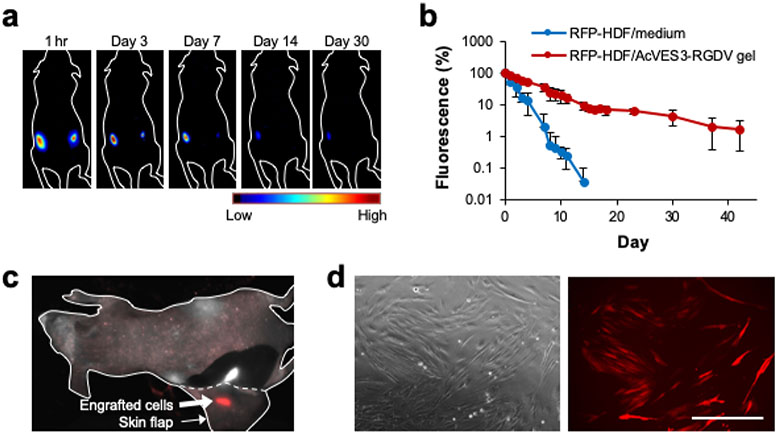
Figure 7.
(a) RFP-HDFs were encapsulated in AcVES3-RGDV gels (106 cells per 100 μL) and injected into the left dorsal region. In the control, the cells were suspended in medium (106 cells per 100 μL) and injected into the right dorsal region of the same mouse. Fluorescent images were recorded over time. (b) RFP fluorescence from an ROI at the implantation site plotted as a function of time. Data are represented as mean ± SD (n = 3). (c) RFP fluorescence from the dissected subcutaneous tissue on day 42. Red and white signals represent RFP fluorescence and tissue autofluorescence, respectively. (d) Cells resected from an RFP-positive tissue were cultured in vitro for 10 days (scale bar = 400 μm).

