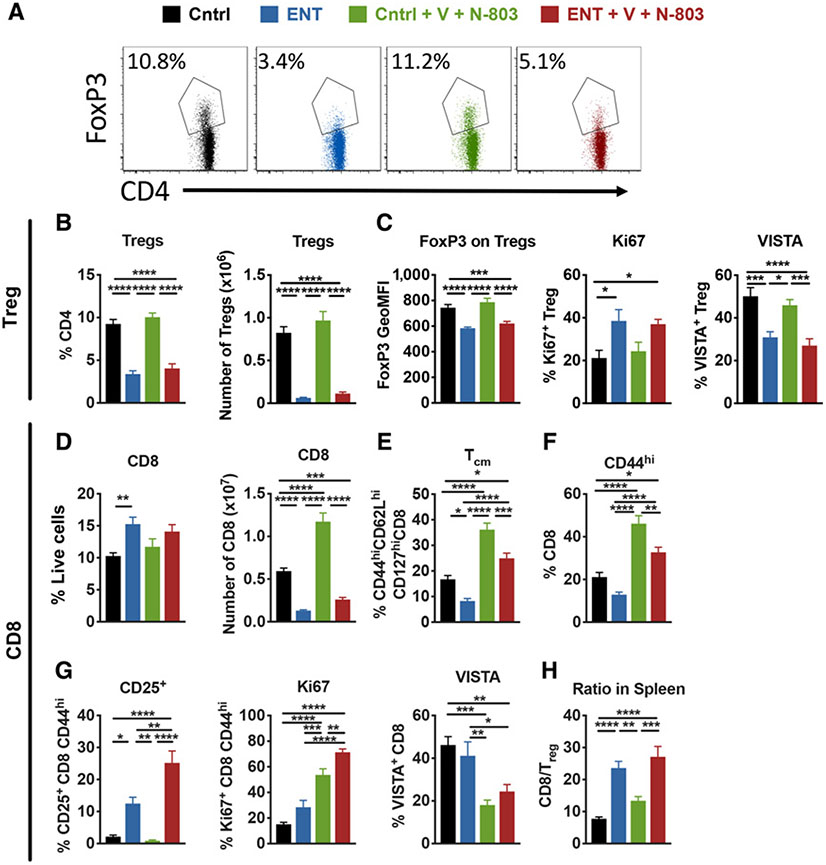
Figure 3.
In the spleen, entinostat reduces Tregs and N-803 and vaccine drive a CD8 activation phenotype. MC38-CEA tumor–bearing mice were treated as described in Fig. 1D and sacrificed on day 24. Tregs and CD8+ T cells in spleen were analyzed by flow cytometry. All gating strategies are listed in Supplementary Table S2. A, Representative dot plots showing gates for FoxP3+ Tregs. B, Treg frequency and numbers. C, Expression of FoxP3 (gMFI), Ki67, and VISTA on Tregs. D, CD8+ T-cell frequency and numbers. E, Frequency of CD8+ T cells with central memory phenotype CD44hiCD62LhiCD127hi (TCM). F, Frequency of CD44hi CD8+ T cells. G, Expression levels of CD25, Ki67, and VISTA on CD8+ T cells. H, Ratio of CD8+ T cells to Tregs. Graphs show mean ± SEM of combined data from 2 independent experiments; n = 11–12 mice/group. *, P < 0.05; **, P < 0.01; ***, P < 0.001; ****, P < 0.0001, one-way ANOVA. ENT, entinostat; V, vaccine.

