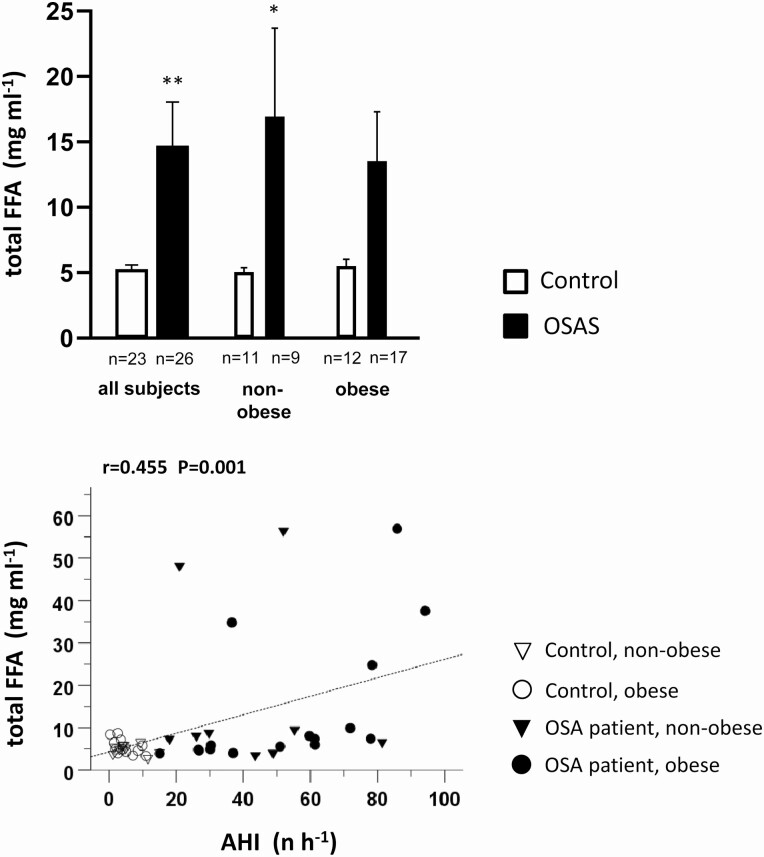
Figure 1.
Upper panel: Total free fatty acid (FFA) plasma levels between 7 am and 9 am in obstructive sleep apnea (OSA) patients and healthy control individuals and their nonobese and obese strata. Mean values ± SEM, *P less than .05; **P less than .01 OSA vs control. Lower panel: Correlation of total FFA plasma levels to apnea-hypopnea index (AHI) within the total study population with indication of the individual assignment to the 2 groups, OSA and controls, and their nonobese or obese strata as well as of Pearson correlation coefficient r and P.

