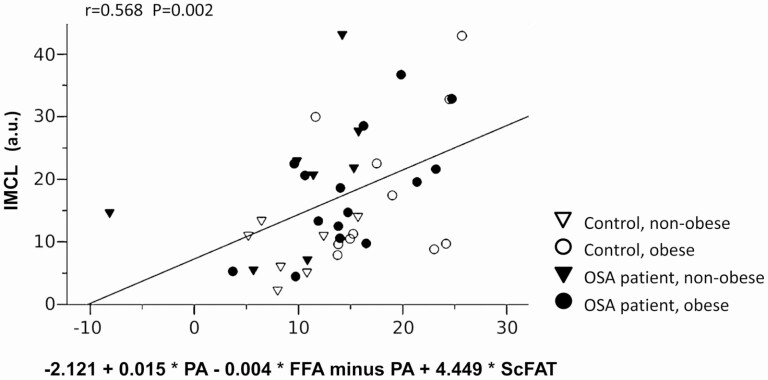
Figure 3.
Scatter plot representing explorative multivariable prediction of intramyocellular lipid (IMCL) (y-axis) by the combination of total fatty acid (FFA) and palmitic acid (PA) as well as thigh subcutaneous fat volume (ScFAT) according to regression analysis (x-axis) within the total study population (for details see “Materials and Methods” and “Results”).

