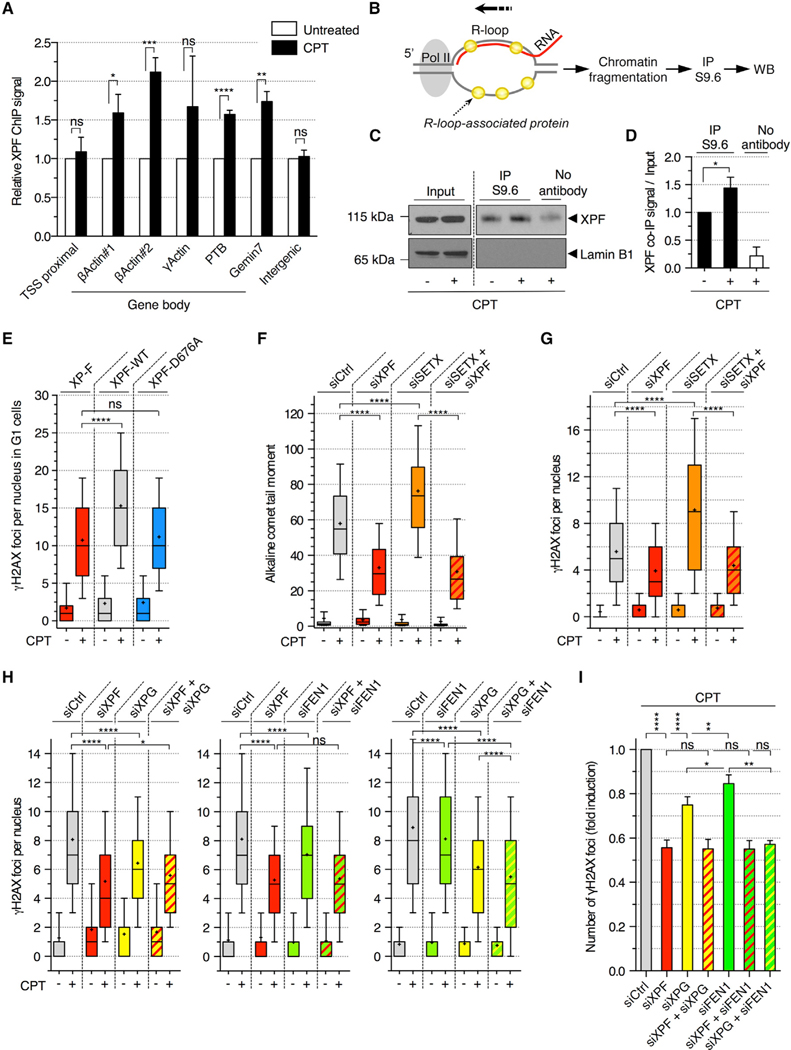
Figure 4. R-Loop-Dependent DSBs Are Mediated by XPF, XPG, and FEN1 in Non-replicating Cells Treated with CPT.
(A) ChIP analysis of XPF in quiescent cells treated with CPT (25 μM; 20 min). Values are normalized to untreated cells (means ± SEM; n = 4). ns, *p < 0.05, **p < 0.01, ***p < 0.001, ****p < 0.0001 (two-tailed unpaired t test). Intergenic: negative control.
(B) R-loop IP method for the detection of R-loop-associated proteins.
(C and D) R-loop IP was carried out in quiescent cells treated with CPT (25 μM; 20 min). Input and IP fractions were probed with XPF or lamin B1 antibodies.
(C) Representative immunoblots.
(D) Quantification of R-loop IP. Values were normalized to input and DMSO sample (means ± SEM; n = 3). *p < 0.05 (two-tailed unpaired t test).
(E) XPF-deficient patient cell line (XP-F) complemented with a wild-type (XPF-WT) or a nuclease-dead (XPF-D676A) XPF were incubated with 10 μM EdU for 30 min before treatment with CPT (25 μM; 1 h) and stained for γH2AX and Hoechst 33342 (DNA). The number of γH2AX foci per G1 nucleus (EdU-negative and low Hoechst 33342) is shown. ns, ****p < 0.0001 (two-tailed unpaired t test).
(F–I) Quiescent cells were transfected with the indicated siRNAs and treated with CPT (25 μM; 1 h).
(F) Detection of SSBs by alkaline comet assays. The quantification of comet tail moments is shown. ****p < 0.0001 (one-way ANOVA).
(G) Number of γH2AX foci per nucleus. ****p < 0.0001 (one-way ANOVA).
(H) Number of γH2AX foci per nucleus. ns, *p < 0.05, ****p < 0.0001 (one-way ANOVA).
(I) The fold induction of γH2AX was calculated by subtracting the number of foci of untreated cells from that of CPT-treated cells and normalized to siCtrl cells treated with CPT in each experiment (means ± SEM; n ≥ 3). ns, *p < 0.05, **p < 0.01, ****p < 0.0001 (two-tailed unpaired t test).
A representative experiment out of 2 (E and G) or R3 (F and H) is shown.
See also Figure S4.

