
Fig. 2.
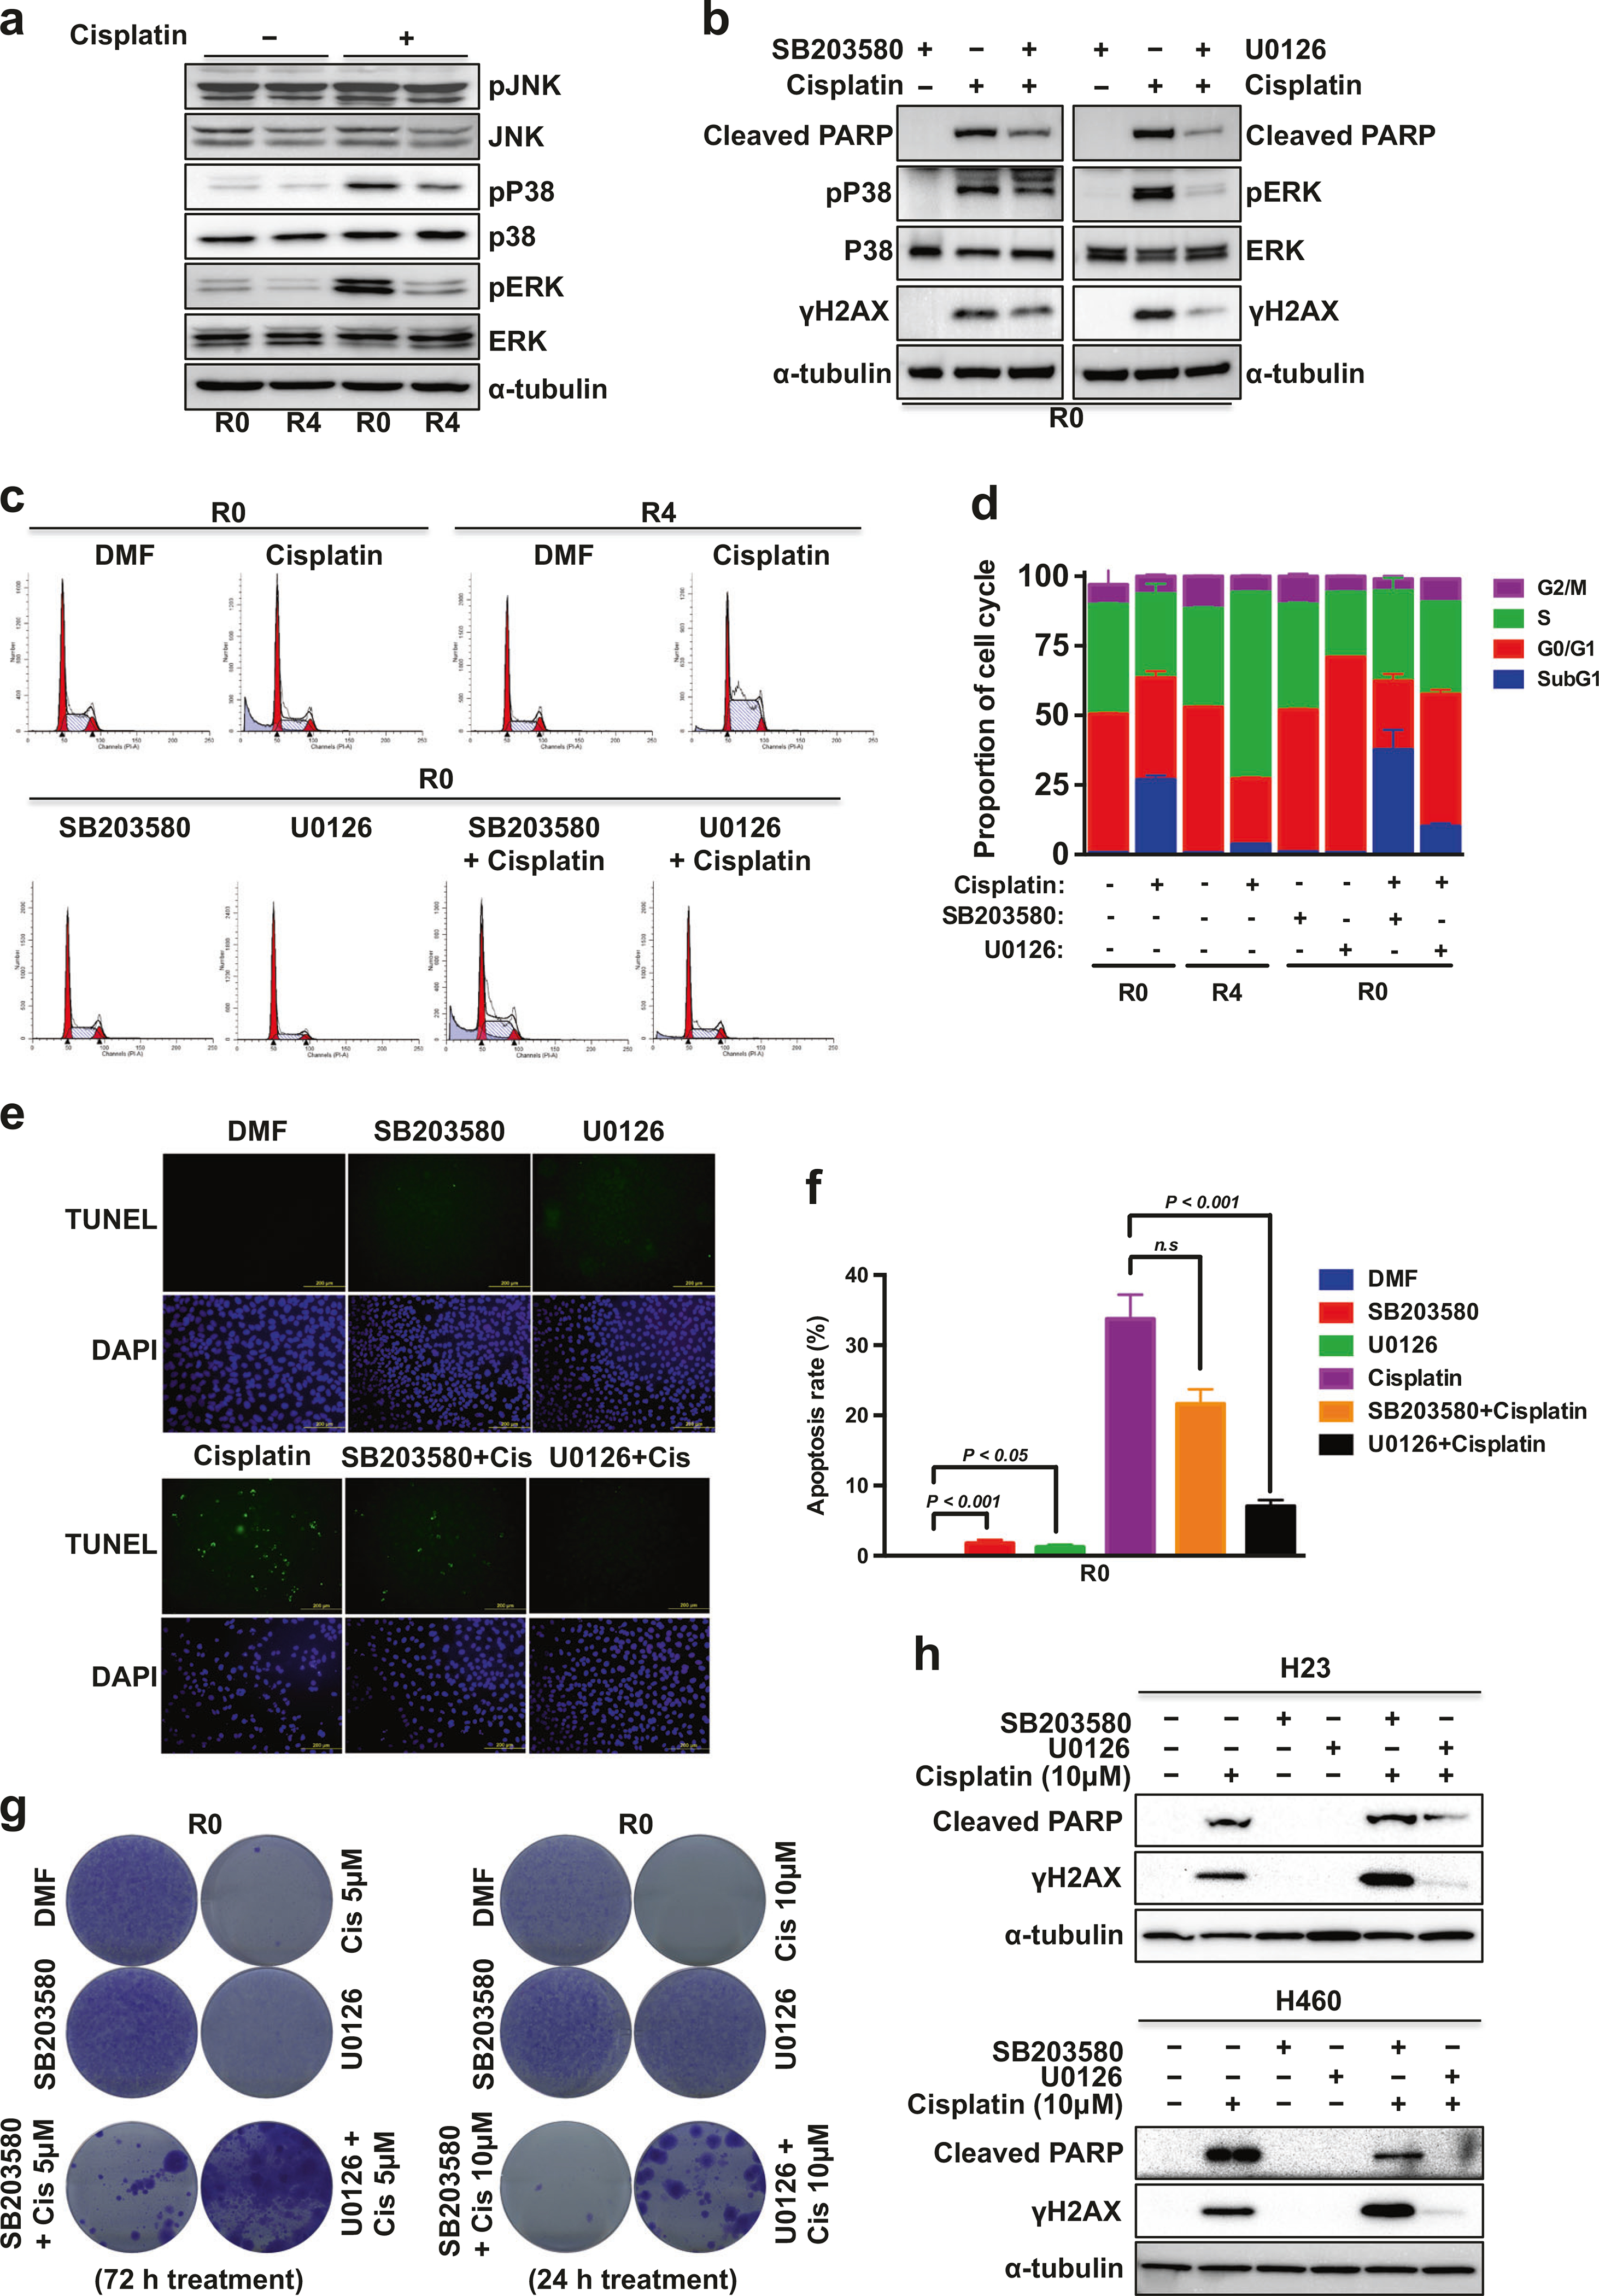
Inhibition of ERK activation attenuates cisplatin-induced apoptosis. a, b WB of cells grown in 10 μM cisplatin with/without inhibitor (10 μM) for 24 h. c Cell cycle distribution analysis. d Representative cell cycle histogram of (c) demonstrating the percentage of the cells in each phase. Data are means ± s.d. from n = 3. e Representative images of TUNEL staining of R0 cells after 15 μM cisplatin treatment for 24 h with/without inhibitor (10 μM). f Representative histogram showing the percentage of apoptotic cells (TUNEL-positive cells). Data are means ± s.d. from three independent experiments, and statistical significance was determined by one-way ANOVA with Dunnett’s multiple comparisons test. g Cell survival of A549-R0 cells under cisplatin treatment with/without inhibitor (10 μM) was assessed by clonogenic assays. h WB of H23 or H460 cells were grown in cisplatin with/without inhibitor (10 μM) for 24 h