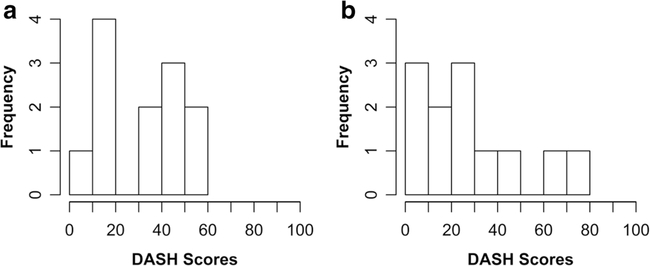
Fig. 2.
Histograms of DASH scores at baseline (a) and 6 months (b), n = 12. Possible scores range from 0 to 100, with higher scores indicating greater disability. At baseline, scores ranged from 6.7 to 55. At 6 months, scores ranged from 7.8 to 71.0. There is no evidence of ceiling or floor effects for DASH scores at either time point (created using RStudio)

