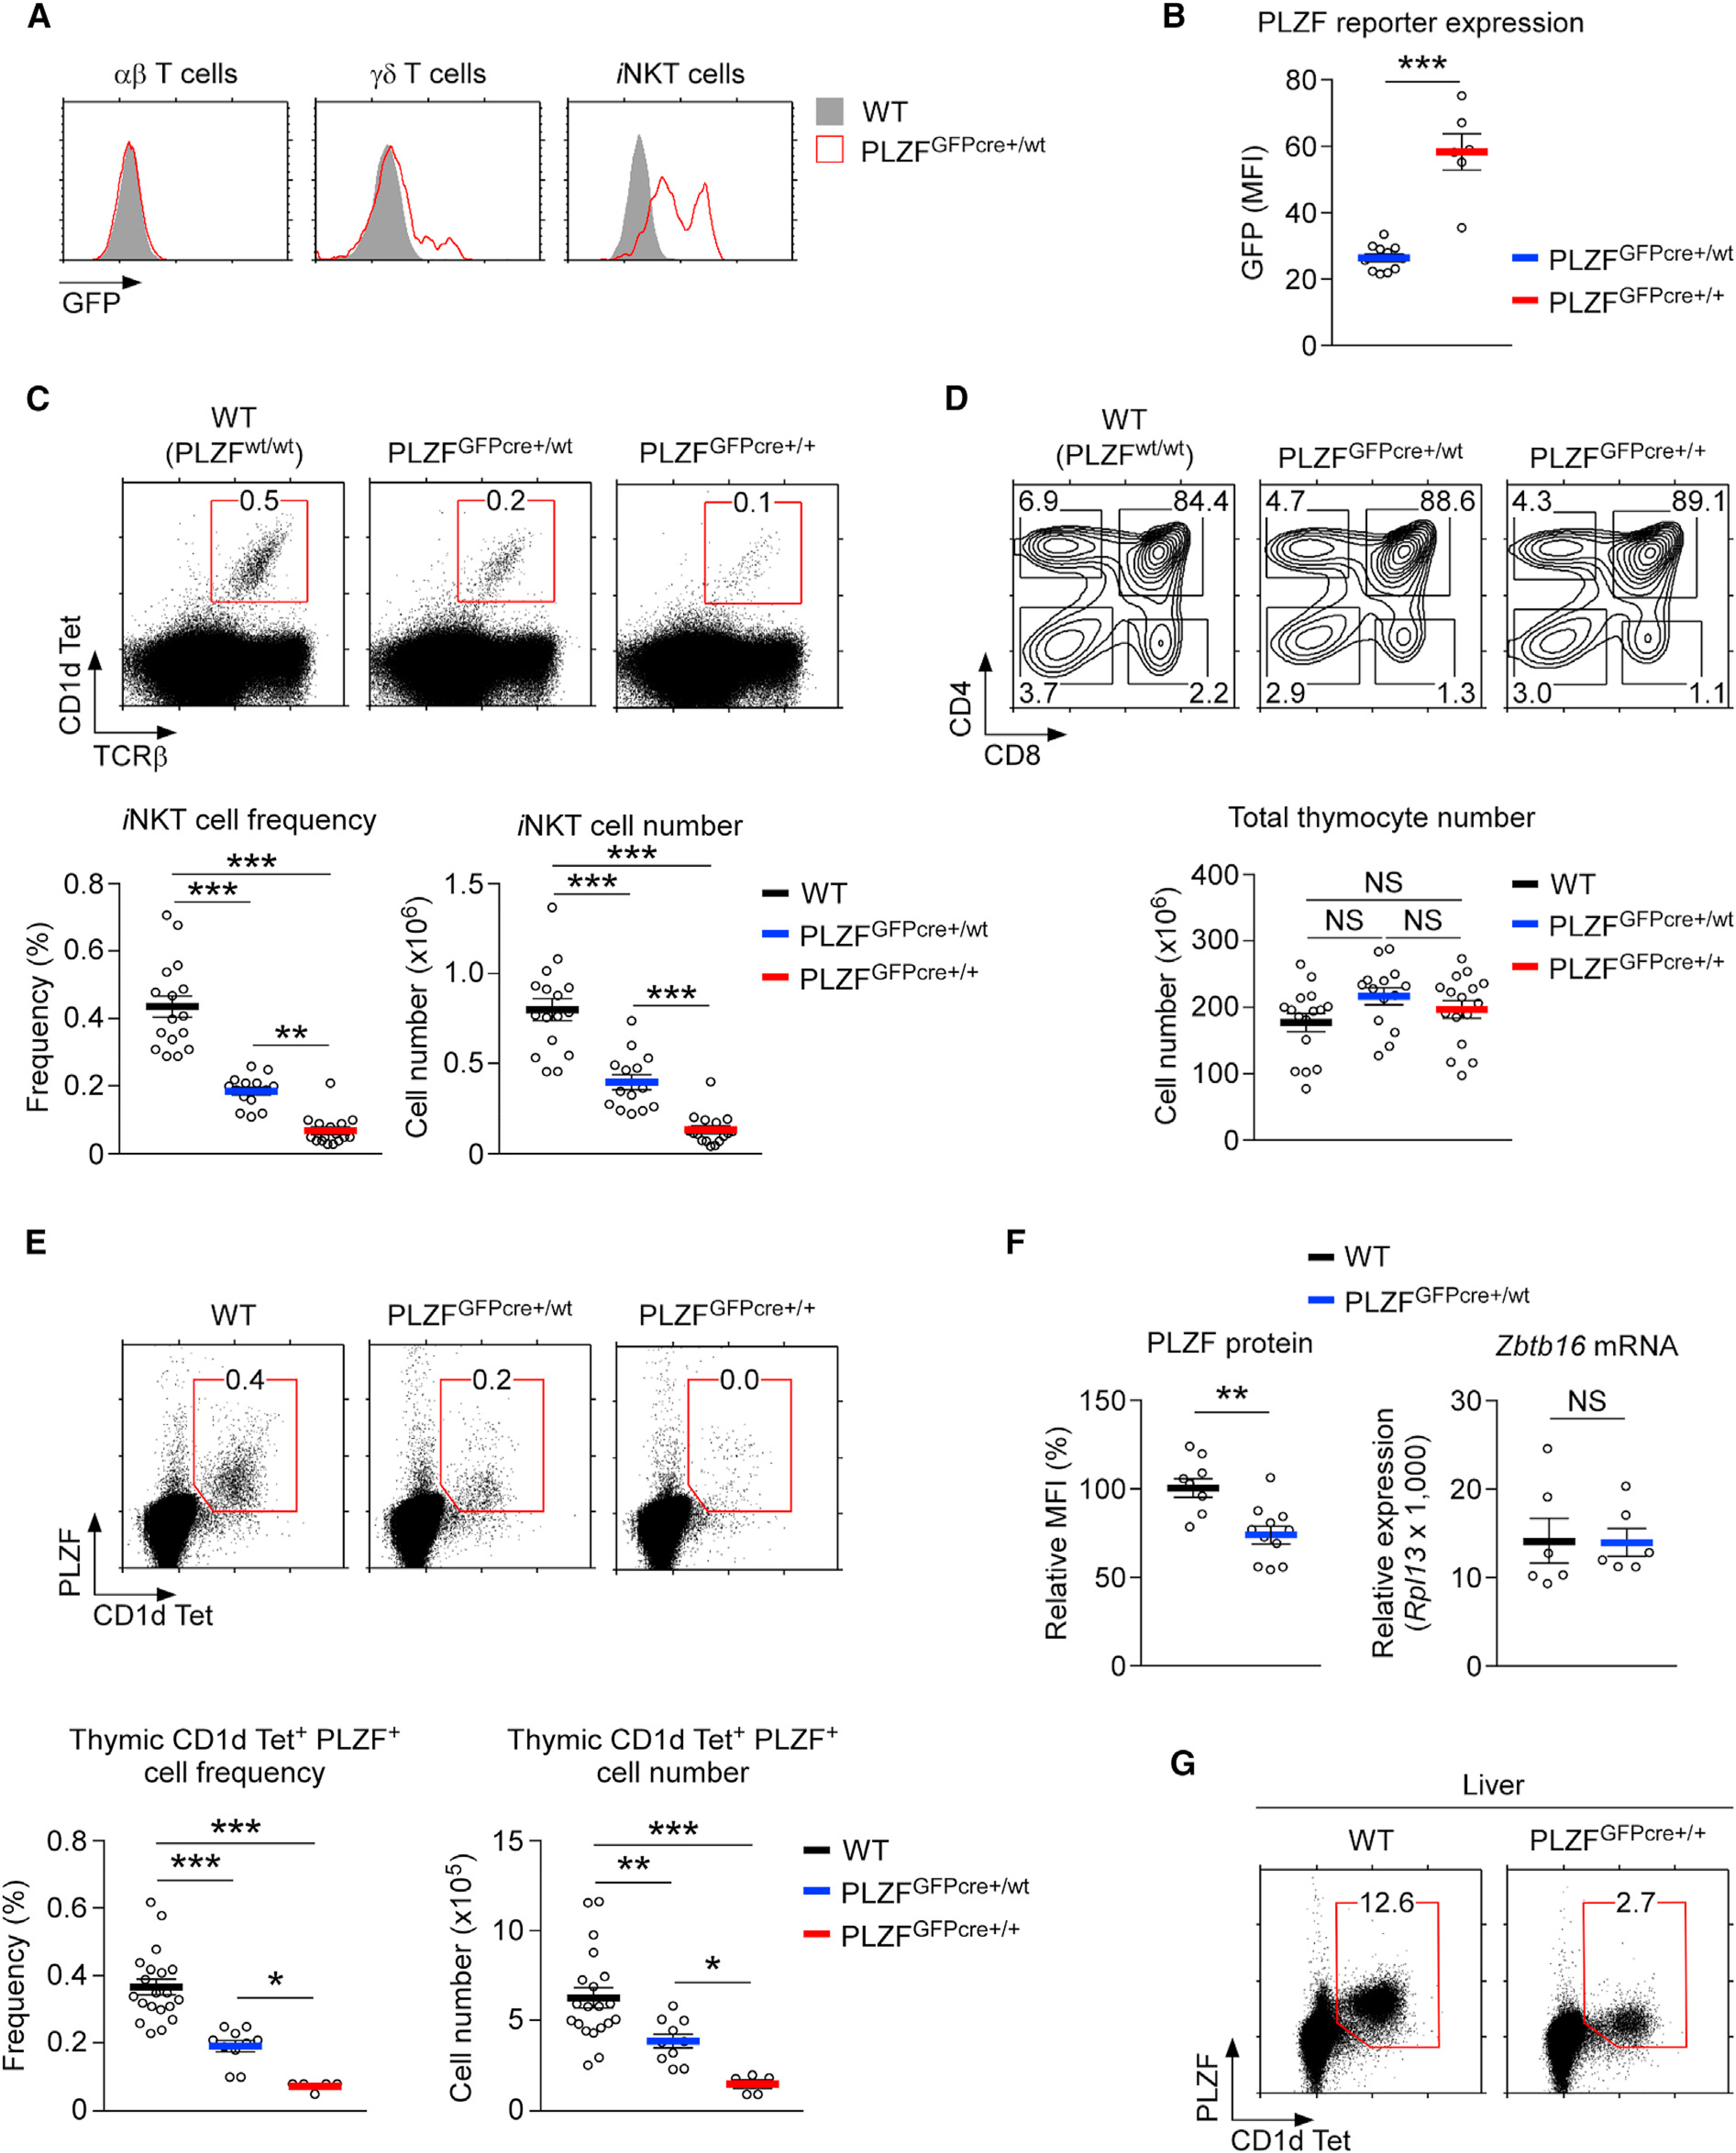
Figure 1. The PLZFGFPcre Knockin Encodes a Hypomorphic Zbtb16 Allele.

(A) PLZF-GFP reporter expression in thymic αβ T cells (CD1dTet-negative), γδ T cells, and iNKT cells of WT and PLZFGFPcre+/wt mice.
(B) PLZF-GFP reporter expression in thymic iNKT cells of PLZFGFPcre+/wt and PLZFGFPcre+/+ mice. Results show the summary of 4 independent experiments with 11 PLZFGFPcre+/wt and 6 PLZFGFPcre+/+ mice.
(C) Thymic iNKT cells were identified by CD1dTet and anti-TCRβ staining (top), and their frequencies and numbers were determined for the indicated mouse strains (bottom). Results show the summary of 13 independent experiments with 16 WT, 14 PLZFGFPcre+/wt, and 16 PLZFGFPcre+/+ mice.
(D) CD4 versus CD8 profiles (top) and total thymocyte numbers (bottom) of the indicated mice. Results show the summary of 13 independent experiments.
(E) PLZF expression in thymic iNKT cells (top) and their frequencies and numbers (bottom) in WT, PLZFGFPcre+/wt, and PLZFGFPcre+/+ mice. Data are from 5 independent experiments with 20 WT, 10 PLZFGFPcre+/wt, and 5 PLZFGFPcre+/+ mice.
(F) Intracellular PLZF protein expression in CD1dTet+PLZF+ iNKT cells (left) and the Zbtb16 mRNA contents of mature iNKT cells (right) of WT and PLZFGFPcre+/wt thymocytes. Zbtb16 mRNA was measured in FACS (fluorescence-activated cell sorting)-sorted CD24loCD1dTet+ iNKT cells. Data show the summary of 3 independent experiments.
(G) PLZF expression in liver iNKT cells of WT and PLZFGFPcre+/+ mice. Dot plots are representative of 3 independent experiments.
Data are shown as mean ± SEM. Differences between groups were determined either with two-tailed Mann-Whitney U test or Kruskal-Wallis test to calculate p values, where *p < 0.05; **p < 0.01; ***p < 0.001 were considered statistically significant. NS, not significant.
