
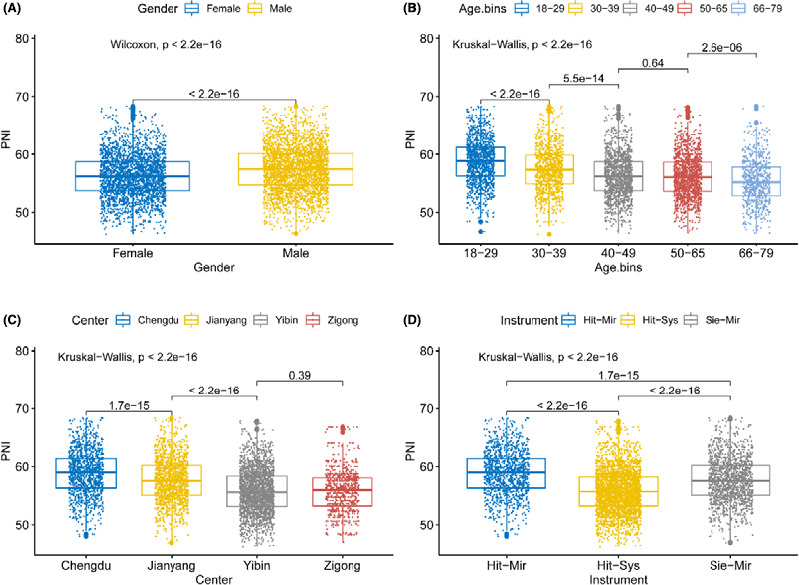
FIGURE 3.
The boxplot of PNI stratified by gender, age, center, and instrument in training group. Our boxplot is not a standardized way and displays the distribution of data based on the three numbers summary: first quartile, median, third quartile
Official websites use .gov
A
.gov website belongs to an official
government organization in the United States.
Secure .gov websites use HTTPS
A lock (
) or https:// means you've safely
connected to the .gov website. Share sensitive
information only on official, secure websites.
The boxplot of PNI stratified by gender, age, center, and instrument in training group. Our boxplot is not a standardized way and displays the distribution of data based on the three numbers summary: first quartile, median, third quartile