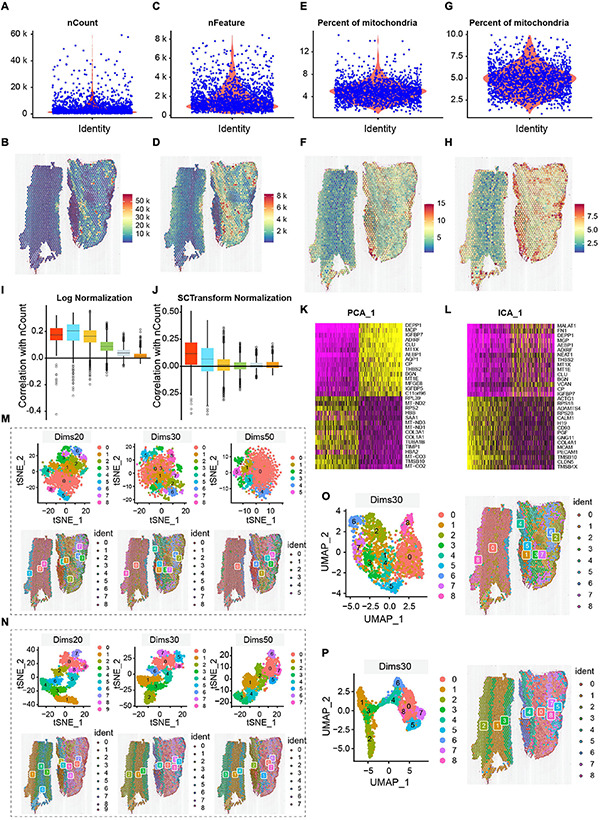
FIGURE 2.

Quality control and ST data analysis. (A,B) The number of nCount_RNA is range of 10,000–20,000, with the maximum not exceeding 60,000, and spatial UMIs distribution is concentrated in the aortic of tunica media and external. (C,D) The number of genes is mostly between 1,000 and 7,500. Combined with the distribution of UMIs data, the region with a high number of genes also had a high number of UMIs. (E,F) The percentage of mitochondria is low, between 1 and 12%. Correspondingly, the distribution of spatial UMIs in the tunica media and external is also rare. (G,H) Cells with >10% mitochondrial reads are filtered, and display distribution of spatial UMIs. The colors from blue to red represented increasing number of expression. (I,J) Comparison of normalization methods (log and SCTransform normalization), the SCTransform normalization is superior to Log Normalization. (K,L) Comparison of compositional analysis (PCA and ICA). (M–P) Comparison of dimensionality reduction and clustering methods, among them, (M,O) are under the ICA condition, the distribution of t-SNE (dims 20, 30, 50) and UMAP (dims 30); (N,P) are under the PCA condition, the distribution of t-SNE (dims 20, 30, 50) and UMAP (dims 30). Overall, PCA dims 30 combined with UMAP dimensionality reduction cluster analysis is an appropriate method. The Clusters are labeled using different colors.
