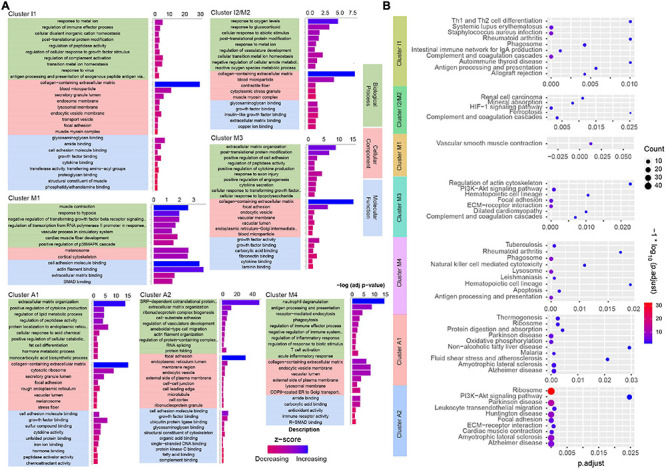
FIGURE 5.

Analysis of GO and KEGG enrichment of clusters in ascending aortic dissection tissue. (A) Analysis of genes enriched by GO terms (biological processes, cellular component, molecular function) (p. adjust) in each cluster. The function is reflected by z-score and up color-coded from red to blue. (B) KEGG analysis for hallmark genes of enriched pathways in each cluster. The gradient color represents the P-value; the size of the black spots represents the gene number.
