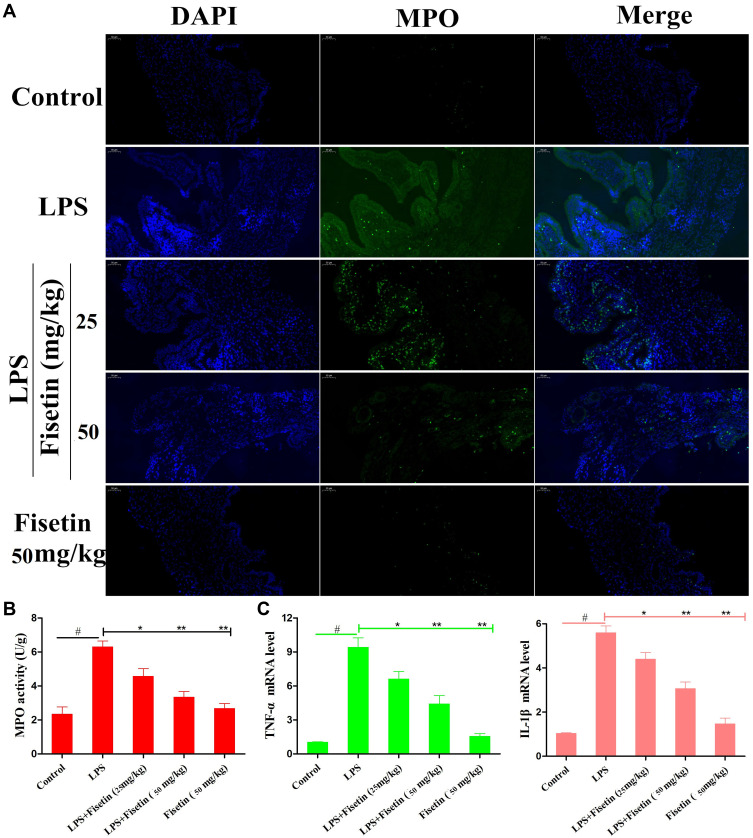
Figure 4.
Effects of fisetin on LPS-induced inflammatory responses in mice. (A and B) MPO activity. (C) Expression of TNF-α and IL-1β mRNA in tissues. GAPDH serves as the control. All data are represented as the mean ± S.E.M. of three independent experiments. Hash marks indicate P < 0.05 versus control group. Asterisks indicate P < 0.05 versus LPS group. Double asterisk indicate P < 0.01 compared with LPS group.

