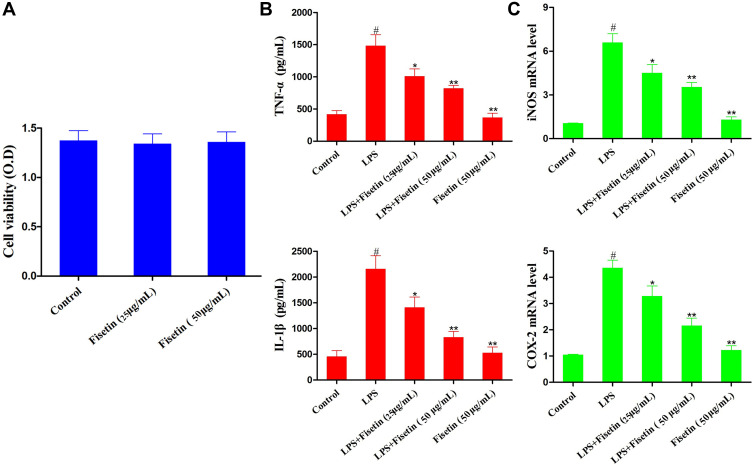
Figure 6.
Effects of fisetin on LPS-induced inflammatory responses in BEND cells. Cells were subjected to different concentrations of fisetin for 1 h, and then challenged with LPS (1 μg/mL). (A) Effect of fisetin on the cell viability was measured by MTT assay. (B) Effects of fisetin on the expression of TNF-α and IL-1β were determined by ELISA assay. (C) Expression of iNOS and COX-2 mRNA in LPS-stimulated BEND cells using qRT-PCR method. GAPDH served as the control. All data are represented as the mean ± S.E.M. of three independent experiments. Hash marks indicate P < 0.05 versus control group. Asterisks indicate P < 0.05 versus LPS group. Double asterisk indicate P < 0.01 compared with LPS group.

