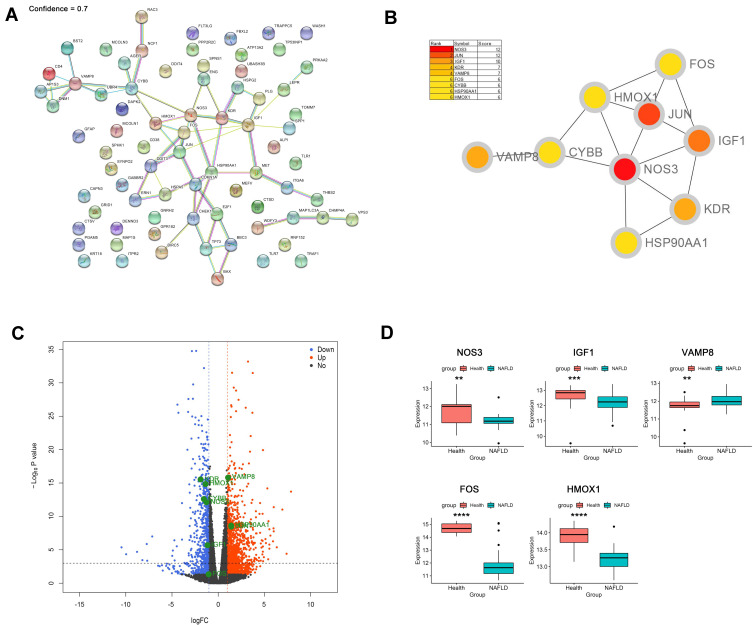
Figure 3.
Identification and verification of hub genes. (A) PPI network analysis of 76 DEARGs (minimum required interaction score 0.7). (B) Identification of hub genes. (C) Volcano plot of the distribution of hub genes expression. (D) Validation of identified gene expression between NAFLDs and normals. (**P<0.01, ***P<0.001, ****P<0.0001).

