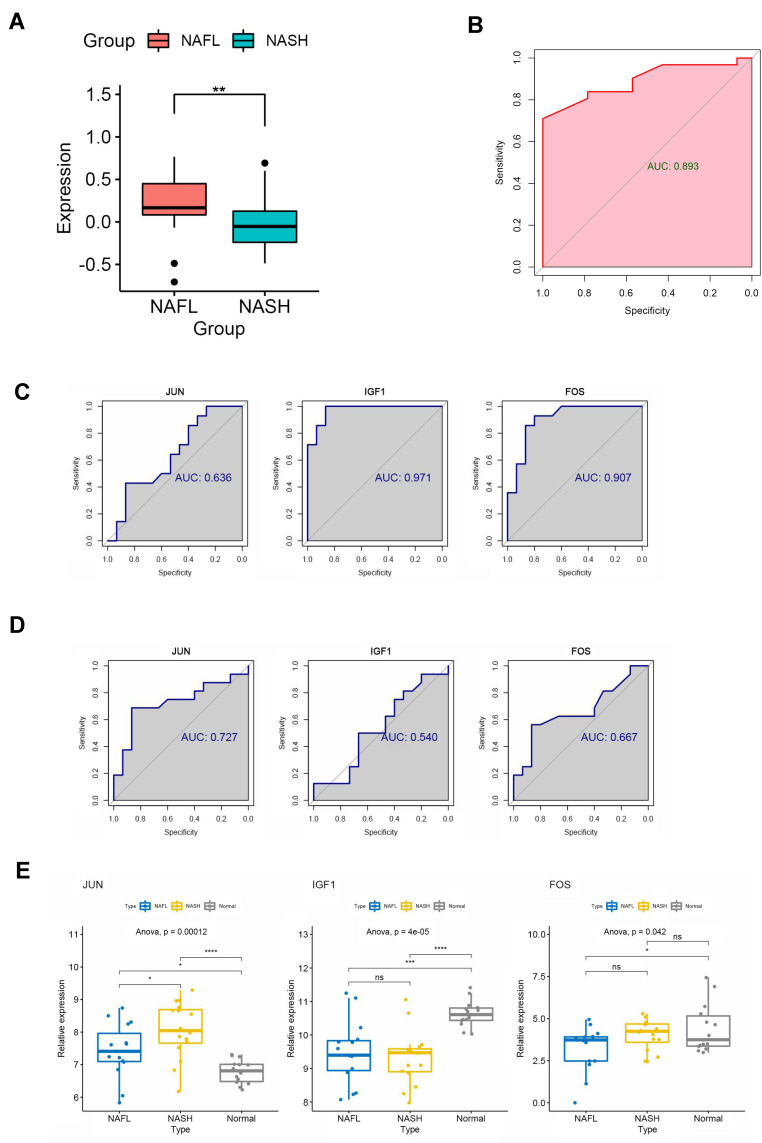
Figure 4.
Identification of central signaling pathways and genes in the development of NAFLD. (A) Difference of MAPK pathway between NAFLs and NASHs by GSVA algorithm. (B) ROC curve to evaluate the effectiveness of the GSVA scores. (C) ROC curves to evaluate the diagnostic value of the identified genes between NAFLDs and normal. (D) ROC curves to evaluate the diagnostic value of the genes between NASHs and NAFLs. (E) The expression of the genes between NASHs, NAFLs, and normal. (*P<0.05,**P<0.01, ***P<0.001, ****P<0.0001).
Abbreviation: ns, no significant.

