Figure 1.
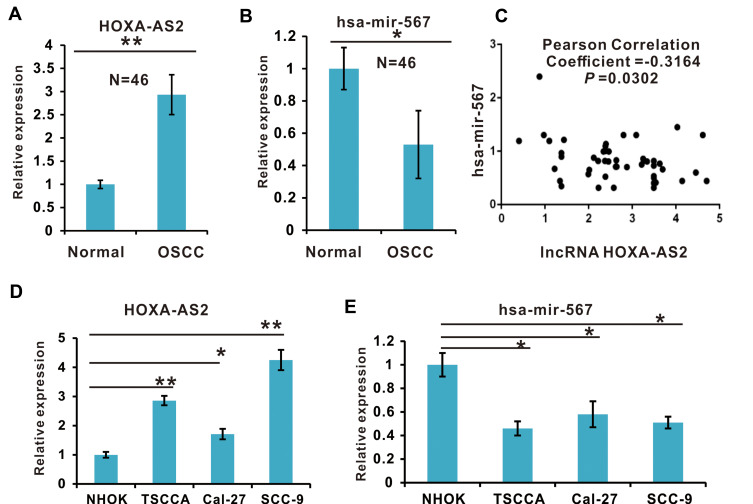
The expression of lncRNA HOXA-AS2 and miR-567 in OSCC Clinical Tissue Samples and Cell Lines. (A) The expression levels of lncRNA HOXA-AS2 in OSCC clinical tissue samples and adjacent normal tissue samples were detected by qRT-PCR. (B) The expression of miR-567 in OSCC clinical tissue samples and adjacent normal tissue samples was detected by qRT-PCR. (C) The relationship between lncRNA HOXA-AS2 and miR-567 expression in OSCC samples was analyzed using the GraphPad Prism software. (D) The expression levels of lncRNA HOXA-AS2 in four OSCC cell lines and the NHOK normal oral cell line were detected by qRT-PCR. (E) The expression of miR-567 in three OSCC cell lines and the NHOK normal oral cell line was detected by qRT-PCR. *Means P <0.05, and **Means P<0.01.

