
Fig. 1.
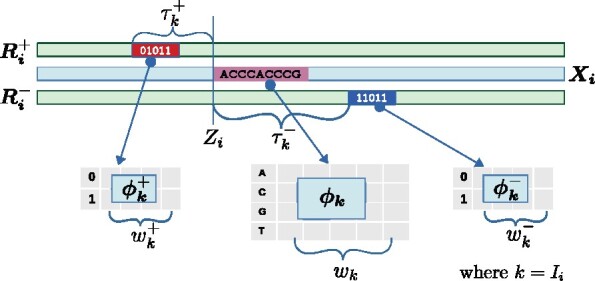
The ith datapoint {DNA sequence , positive reads , negative reads }, belonging to mode k is shown. The red (blue) box of width denotes the positive (negative) read window, which is modeled using Bernoulli probabilities . The 1 and 0 indicate the presence and absence of reads at those positions. The pink box is the DNA site at position Zi, modeled using PWM parameters . The positive (negative) read window is at a fixed distance from Zi. Only and are known; the rest are unknown and learned from the data