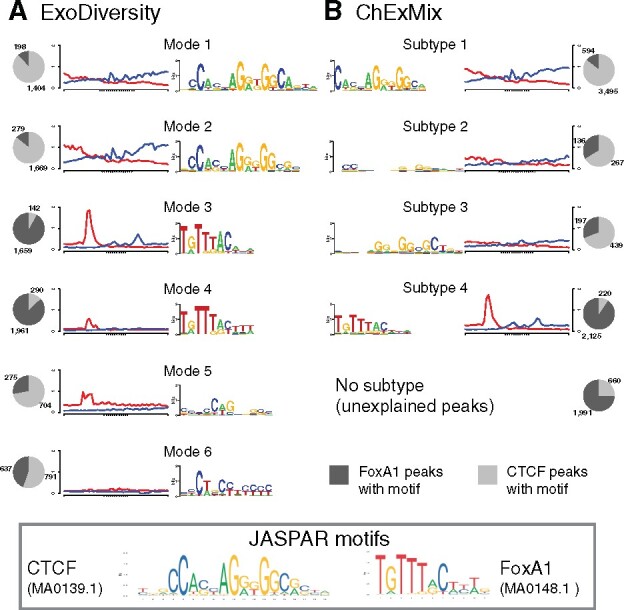
Fig. 2.

Motifs found in a dataset with 5000 FoxA1 and 5000 CTCF regions in the MCF7 cell-line. Note that unlike in ExoDiversity, the numbers in the pie charts for ChExMix do not add up to 10000, because it finds multiple subtypes in some regions and none in others
