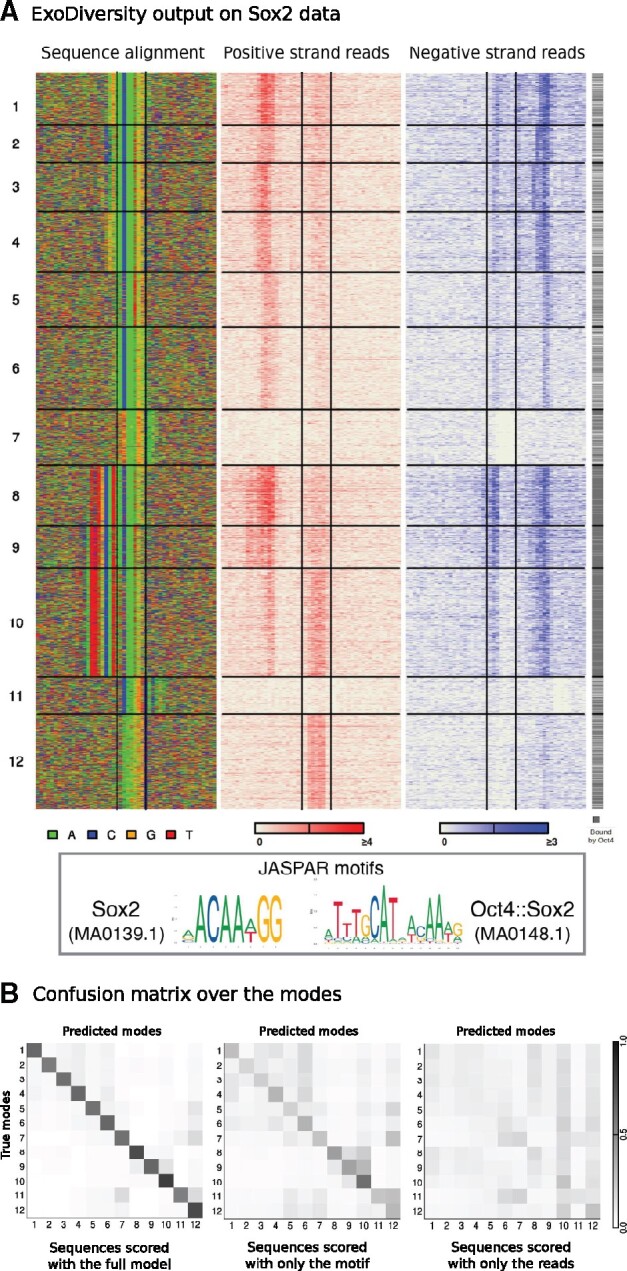
Fig. 3.

ExoDiversity finds 12 modes in the Sox2 dataset. (A) The DNA sequence and the two sets of reads in the 50 bp neighborhood are shown, with the central two lines in each plot marking the site corresponding to the Sox2 motif. The last column indicates which of the regions overlap with the peaks reported in the Oct4 ChIP-nexus experiment. (B) The three matrices show the probability distribution of a sequence over the 12 possible modes, averaged over sequences in each mode. The first matrix considers the full model, while other two use only one of the components: sequence or reads (Methods)
