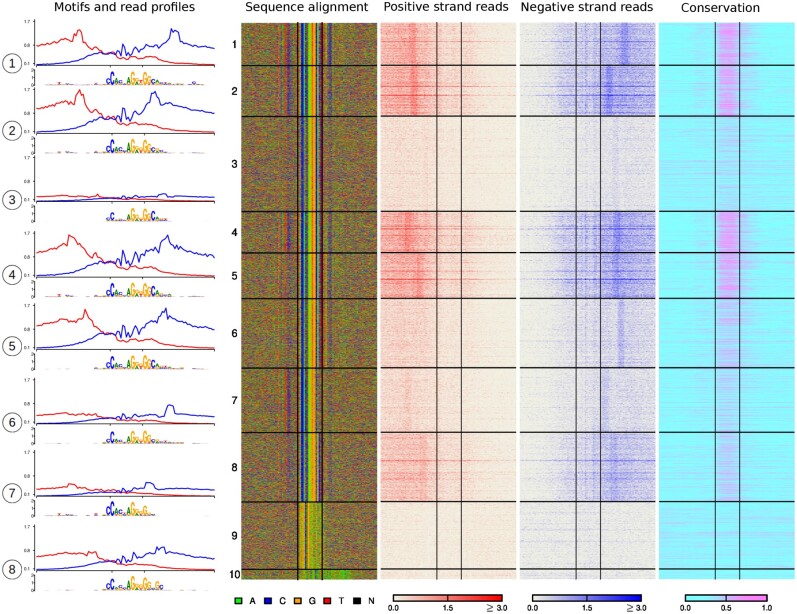
Fig. 6.
ExoDiversity finds 10 modes in the CTCF dataset. The read profiles from both the positive strand (red) and negative strand (blue) over a 100 bp window about the motifs along with motifs learned by ExoDiversity on the eight modes that resemble the canonical CTCF motif are shown in the left. The DNA sequence, the two sets of reads and the corresponding sequence conservation in terms of phastCons scores in the 100 bp neighborhood are shown. The X-axes of the read profiles are aligned corresponding to the 19 bp JASPAR CTCF motif (Fig. 2), which is also shown with a box in the middle of the four heat-map images and two ticks in the read profile. Note that the read profile is over a 100 bp region and the motif shown below is over a 40 bp region

