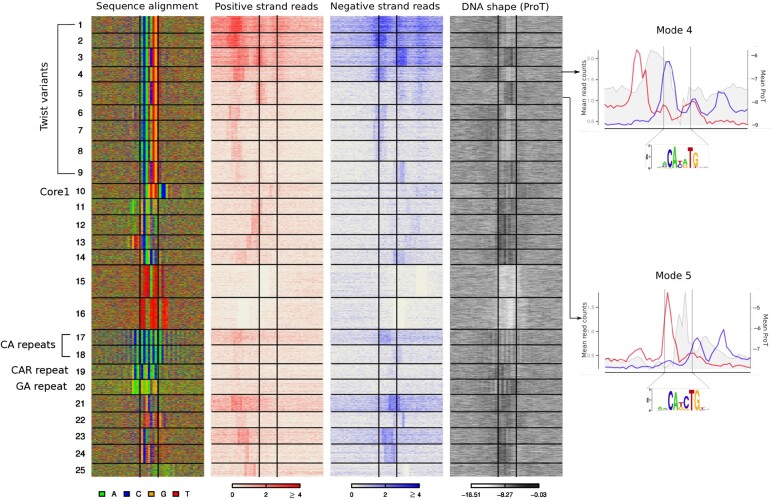
Fig. 7.
ExoDiversity finds 25 modes in the Twist dataset. Modes 1–9 correspond to Twist motifs; Mode 10 matches a Drosophila core promoter motif and Modes 17–20 are di/tri-nucleotide repeat patterns. The DNA sequence, the two sets of reads and the DNA shape for propeller twist in the 50 bp neighborhood are shown, with the central two lines in each plot marking the site corresponding to the Twist motif. Two representative modes for the two Twist variants are shown on the right. The mean positive and negative reads are shown in red and blue plots, respectively (left Y-axis). The mean propeller twist values are shown in grey (right Y-axis)

